. 2018 Jun 1;2(2):218–240. doi: 10.1162/netn_a_00043

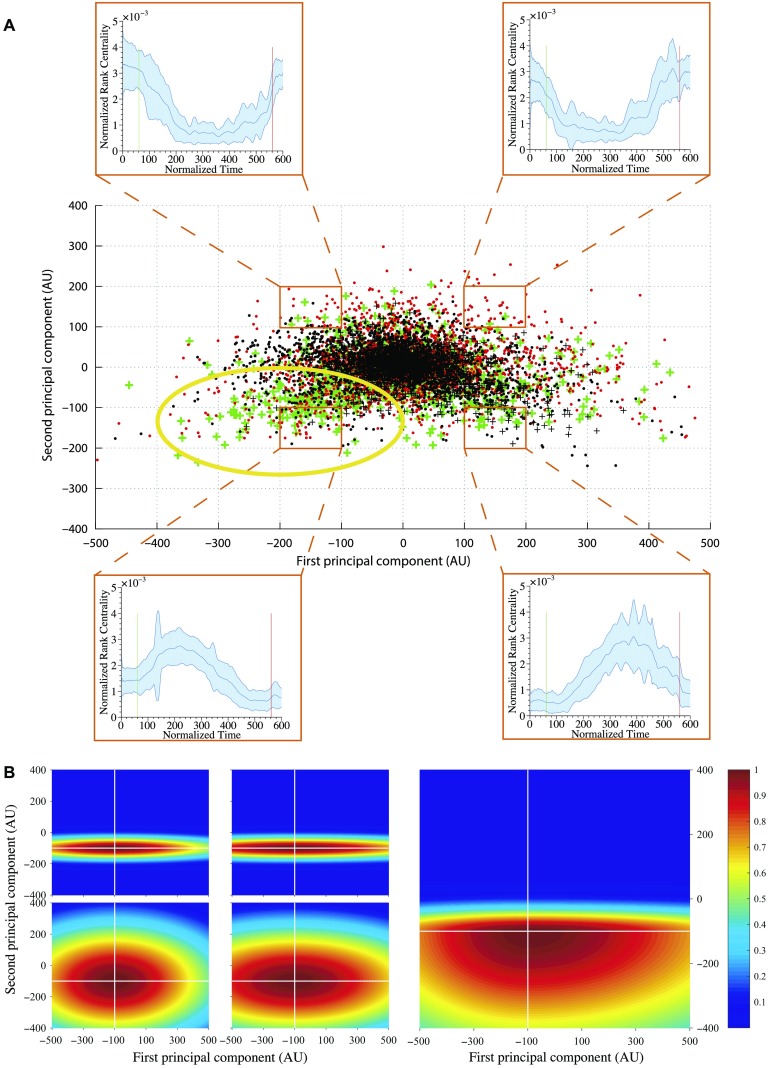
Figure 4. . (A) First and second PCA component distribution. Points in PC space: 1. Green +: resected electrodes in successful outcomes, 2. Red •: nonresected electrodes in successful outcomes, 3. Black +: resected electrodes in failed outcomes, and 4. Black •: nonresected electrodes in failed outcomes. The plots in each of the four insets show the mean normalized rank centrality signal for points in the regions bounded by orange rectangles. The shaded regions in the plots indicate the 1 standard deviation bounds. The green and red lines in the plots indicate the start and end of a seizure episode, respectively. The yellow circle highlights the region of interest, where there are many green markers. (B) An example of the Gaussian weighting function, where the color represents the weight of an electrode being within the EZ. The four plots in the left-hand side represent the Gaussian weighting function for each quadrant, respectively. The right-hand plot is the sum of the four Gaussian functions, which gives the final Gaussian weighting function.

Figure 4.