. 2018 Jun 1;2(2):175–199. doi: 10.1162/netn_a_00029

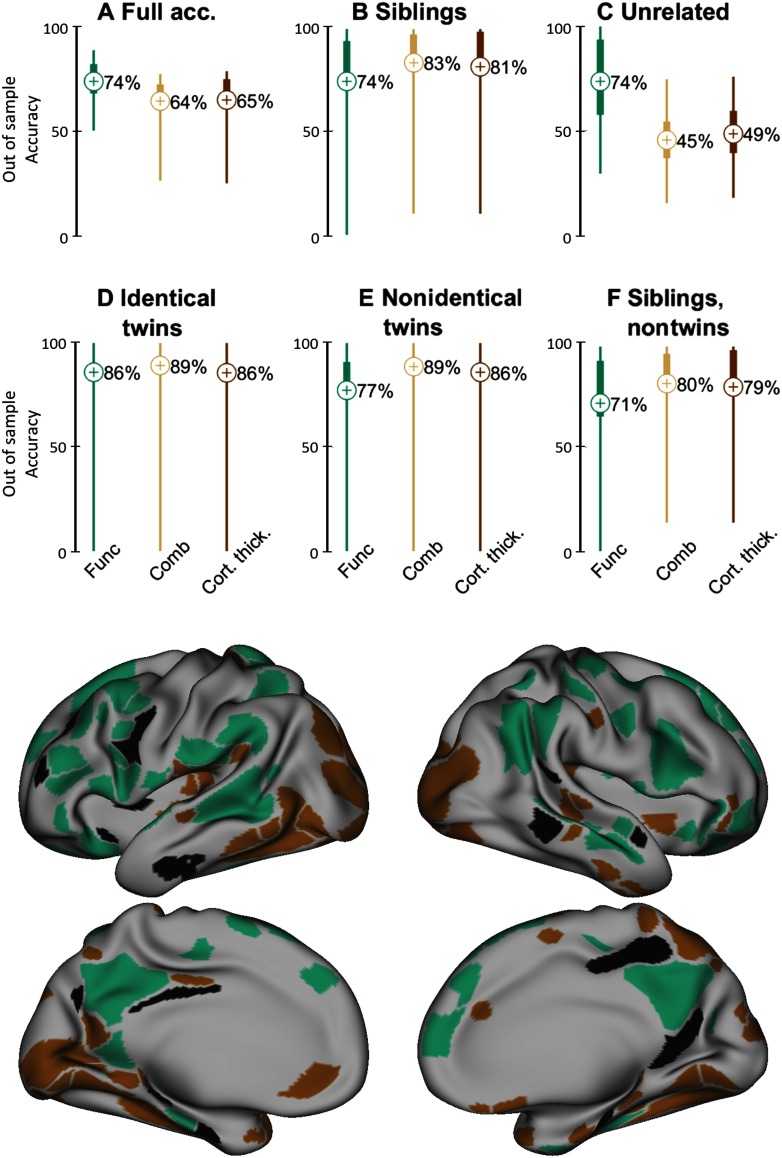
Figure 6. . Comparing the performance of classifiers using connectotyping (green) and anatomical features cortical thickness (brown) to classify kinship in adults when classifiers were trained using data from an independent dataset of youths. Green traces correspond to the results of the classification using connectotyping, as shown in Figure 5. The same classification procedure was repeated using cortical thickness as features (after removing the effect of head size), but using the top 100 more distinct features according to connectotyping (light brown, labeled as “Comb” to indicate “combined”). Dark brown lines show the performance of the classifiers when features and feature selection were based on cortical thickness. Bottom panel (brain figure): Top most distinct features between siblings and unrelated participants (youth) for connectotyping are shown in green. Brown ROIs are the top distinct features according to cortical thickness. ROIs in black (N = 20) correspond to the overlapped regions between connectotyping and cortical thickness.

Figure 6.