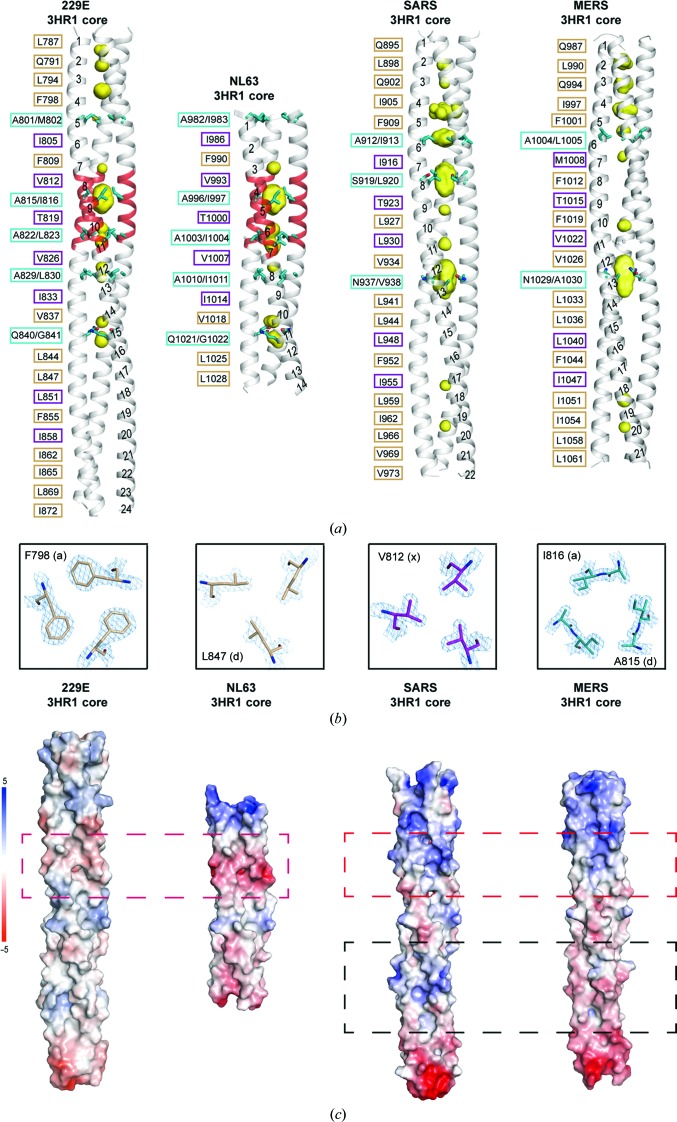
Figure 2.
Differences in the 3HR1 core between α-HCoVs and β-HCoVs. (a) A side-by-side comparison illustrates the differences in the heptad-repeat packing geometry of HCoV-229E, HCoV-NL63 (PDB entry 2ieq), SARS (PDB entry 1wyy) and MERS (PDB entry 4njl). The hydrophobic 3HR1 core is depicted as a grey ribbon, cavities as a yellow surface mesh and the side chains of residues at ‘d/a’ positions as cyan stick models. The helical turns are numbered from the N-terminus to the C-terminus on one of the HR1 helices in the trimer. On the left of each ribbon representation, the packing residues lining the trimeric coiled-coil interface are indicated in black, with residues at the ‘a’ and ‘d’ positions (canonical ‘a’ and ‘d’ layer) boxed in beige, residues at ‘x’ positions (‘x’ layer) in magenta and residues at ‘d/a’ positions (‘da’ layer) in cyan. (b) From left to right: cross-sections of representative ‘a’, ‘d’, ‘x’ and ‘da’ layers in the 3HR1 core of HCoV-229E. The 2F o − F c electron-density maps are contoured at 2σ. (c) Electrostatic surfaces illustrating differences in the 3HR1 core from HCoV-229E, HCoV-NL63, SARS and MERS. The red dashed boxes depict the regions on different 3HR1 cores where the electrostatic surface potentials are opposite in α-HCoVs and β-HCoVs. The black dashed boxes highlight the only regions on SARS and MERS where the electrostatic surface potentials are different.

