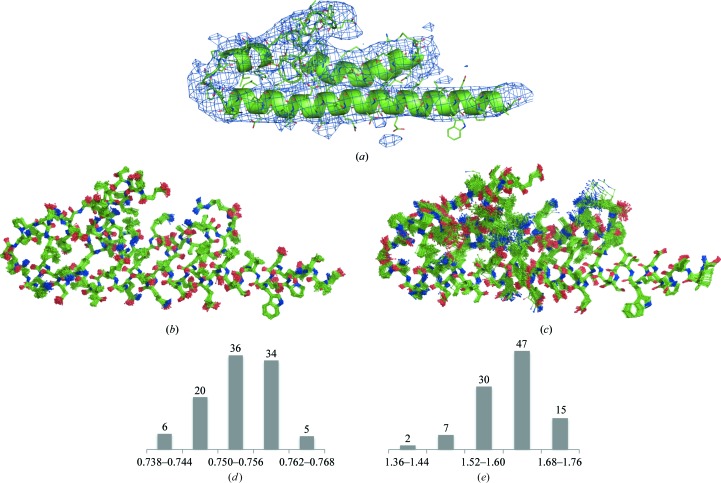
Figure 15.
Illustration of multiple interpretation. (a) PDB entry 3J0R and the corresponding map (EMDB code 5352). (b) Ensemble of 100 perturbed models obtained using MD; all models in the ensemble deviate from the starting model by 0.5 Å. (c) Real-space refined models obtained from (b) using phenix.real_space_refine. (d) Distribution of model–map correlation for refined models. (e) Distribution of r.m.s. deviations between starting and refined models.

