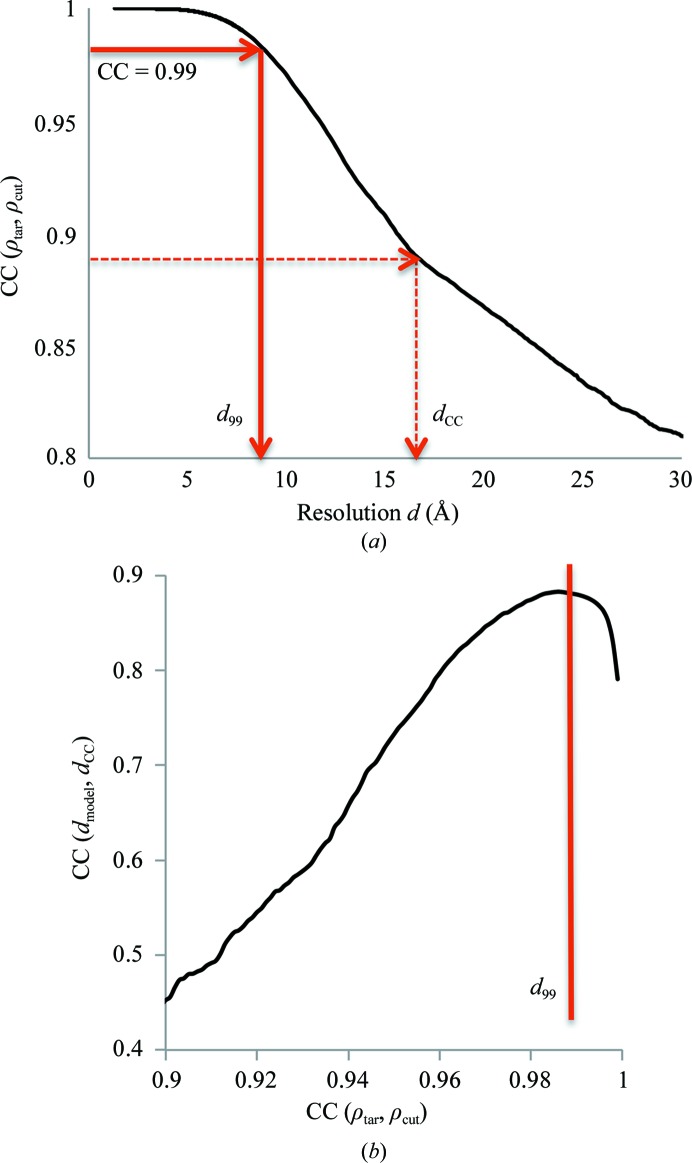
Figure 18.
(a) Correlation coefficient [equation (4), Appendix C ] between the original map and a high-resolution truncated map shown as a function of the resolution value used for truncation for PDB entry 3J27. d 99 corresponds to CC = 0.99. (b) Correlation coefficient between d model and trial resolution cutoffs d CC, calculated using all selected data sets, shown as function of CC(ρtar, ρcut). See Appendix C for details.

