Figure 6.
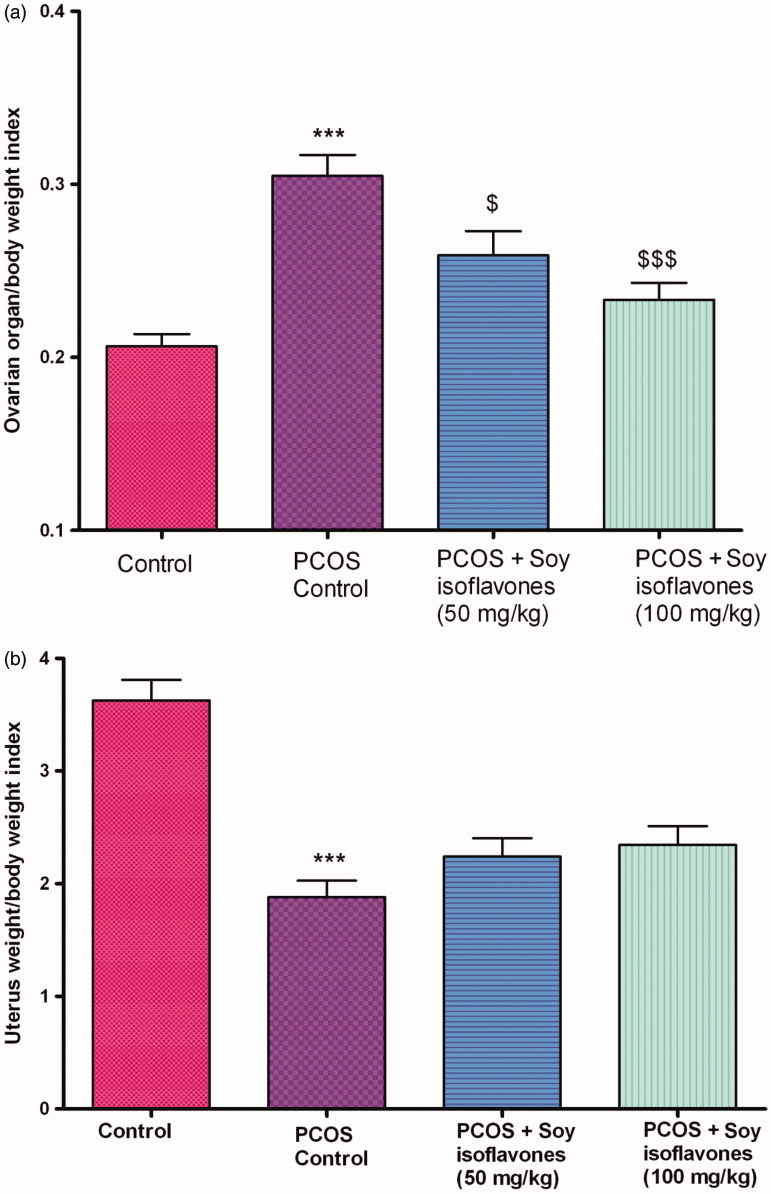
(a) Effect of soy isoflavones treatment on ovarian weight/body weight index in PCOS rat model. (b) Effect of soy isoflavones treatment on uterine weight/body weight index in PCOS rat model. All the values are expressed in mean ± S.D. Statistical analysis was carried out by One way ANOVA followed by Tukey?s multiple comparison test. *** denotes statistical significance as compared to control group rats at p < 0.001. $,$$$ denotes statistical significance as compared to PCOS control group at p < 0.05, p < 0.001 respectively.

