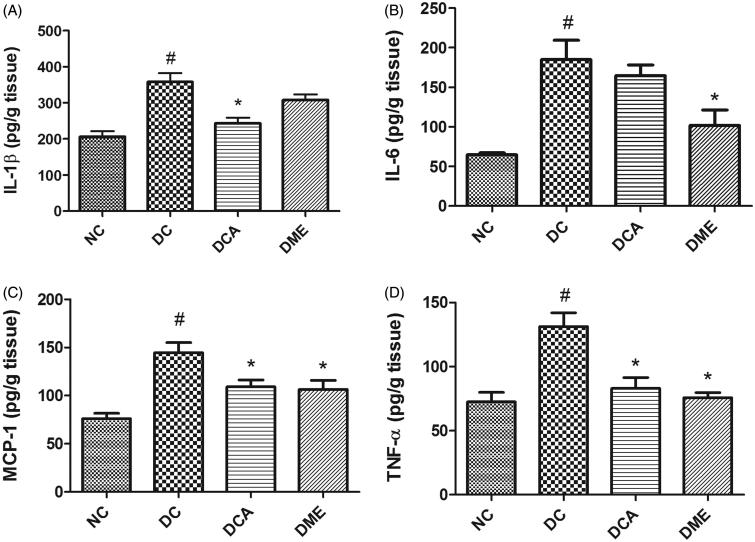
Figure 3.
(A–D) Effects of CA on pro-inflammatory biomarkers in liver in type 2 diabetic rats. NC: normal control; DC: diabetic control; DCA: diabetic rats treated with C. asiatica (L.) Urb. extracts; DME: diabetic rats treated with metformin; IL-1β: interleukin-1beta; IL-6: interleukin-6; MCP-1: monocyte chemoattractant protein-1; TNF-α: tumour necrosis factor alpha. Data are presented as mean ± standard deviation; n = 6. Symbols # and *on bars indicate value differs significantly (p < 0.05) from NC group and DC group, respectively, using Tukey’s multiple comparison or unpaired Student’s t test.

