Figure 4.
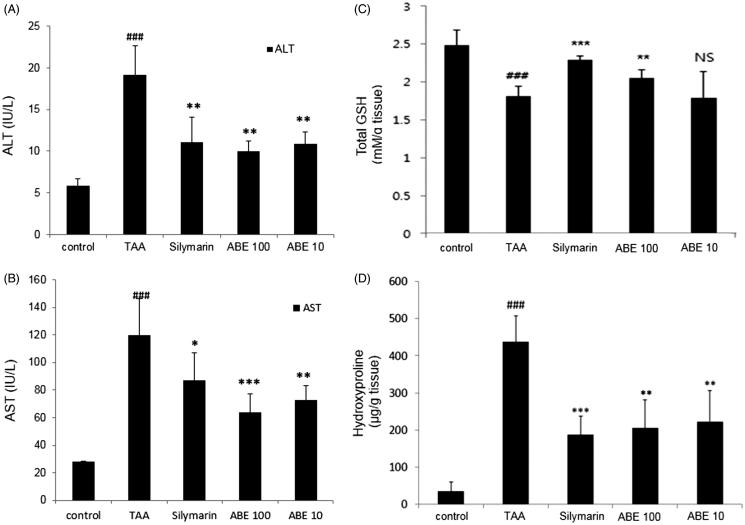
Effect of ABE on AST/ALT levels, total glutathione (GSH) content and hydroxyproline levels in TAA-induced liver fibrosis rats. (A) HSC-T6 cells were incubated with ABE 0.1 and 0.01 mg/mL for 24 h. Fibrosis-related genes expression in HSC-T6 cells were determined by real-time PCR. The results are expressed as normalized fold values relative to the control. Levels of AST (A) and ALT (B) in serum were measured using spectrophotometry. (C) Total GSH contents in liver tissue were measured using spectrophotometry. (D) Hydroxyproline levels from TAA-induced liver tissue of rats. TAA: Thioacetamide-induced liver fibrosis rats, Silymarin: Positive control rats, ABE 100: ABE 100 mg/kg treated rats, ABE 10: ABE 10 mg/kg treated rats. The data are expressed as means ± SEM (n = 6) using one-way analysis of variance (ANOVA) followed by Student’s t-test. ###p < 0.001 as compared with control group, *p < 0.05, **p < 0.01, ***p < 0.001 as compared with TAA group.

