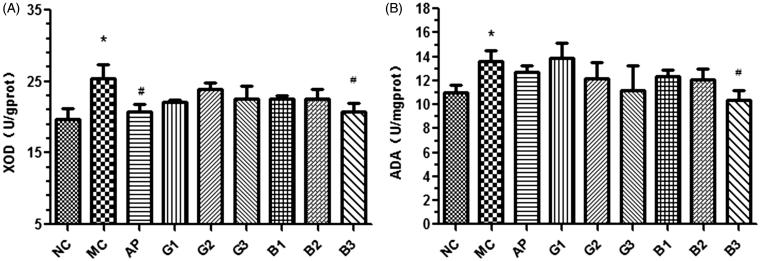
Figure 5.
Effects of GTEs (A) and BTEs (B) on hepatic XOD and ADA in hyperuricemic mice. N = 6 per group. NC: normal control; MC: model group; AP: allopurinol (5 mg/kg); G1, G2 and G3 mean 0.5, 1 and 2 g/kg GTEs; B1, B2 and B3 mean 0.5, 1 and 2 g/kg BTEs; *p < 0.05, compared with the control group; #p < 0.05, compared with the model group.

