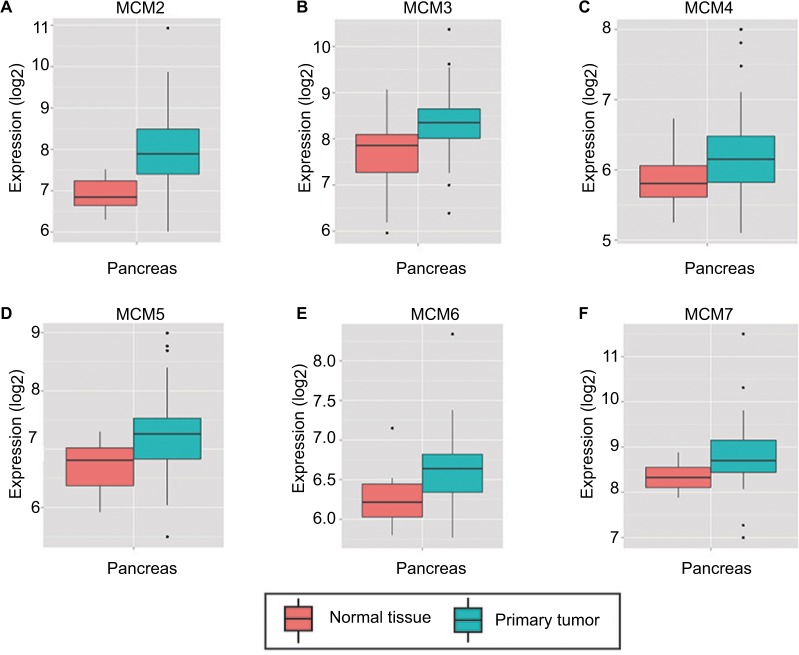
Figure 3.
Expression distribution of MCM2–7 between PC tumor and normal tissues that was carried out by MERAV. Expressions of MCM genes were upregulated in PC tumor tissues.
Notes: Expression distribution box plot of MCM2 (A); MCM3 (B); MCM4 (C); MCM5 (D); MCM6 (E); MCM7 (F).
Abbreviations: MCM, minichromosome maintenance; MERAV, Metabolic gEne RApid Visualizer; PC, pancreatic cancer.

