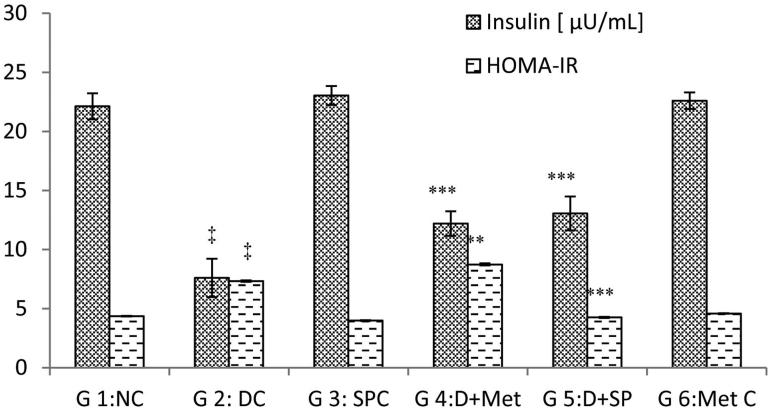
Figure 2.
Effect of S. platensis administration on blood insulin level and HOMA-IR. NC: Normal Control; DC: Diabetic Control; SPC: SP control; D + Met: Diabetic rats treated with metformin; D + SP: Diabetic rats treated with SP; Met C: Metformin Control. Each value represents mean ± SE (n = 8). ‡p < 0.001, compared with group 1 values, *p < 0.05; **p < 0.01, ***p < 0.001 compared with group 2 values at the end of experiment.

