. 2018 Jun 1;2(2):285–302. doi: 10.1162/netn_a_00038

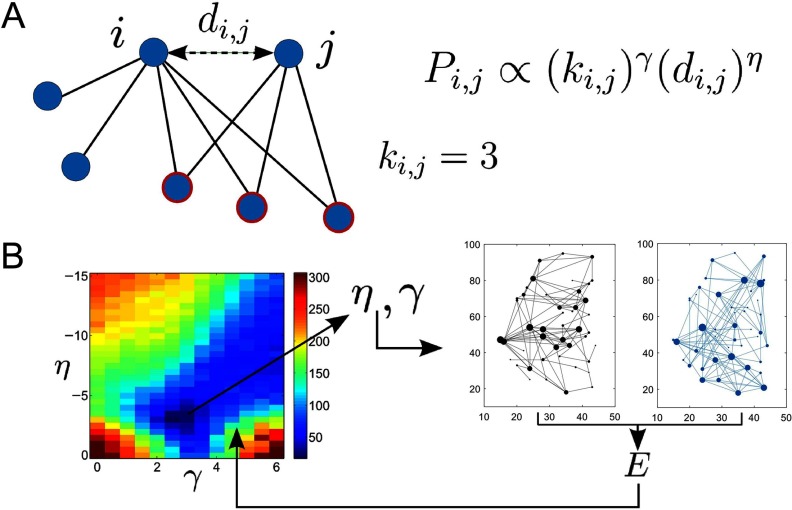
Figure 3. . Schematic of economical clustering generative model. (A) The probability of a new link being added between nodes i and j depends on both the Euclidean distance between them (di,j) and the number of nearest neighbors they have in common (ki,j = 3 in this example). (B) Illustration of the generative model steps. Networks are generated at a range of different η and γ values and their fit to the real brain networks is calculated via an energy function, E, which compares networks on the basis of global efficiency, modularity, mean clustering coefficient, and degree distribution (as used by Vértes et al., 2012). On the left-hand side the energy is plotted as a function of η and γ. On the right-hand side, an example real brain network and generated network are shown for illustration (in black and blue, respectively). The final generated networks are simulated using the optimized values of η and γ.

Figure 3.