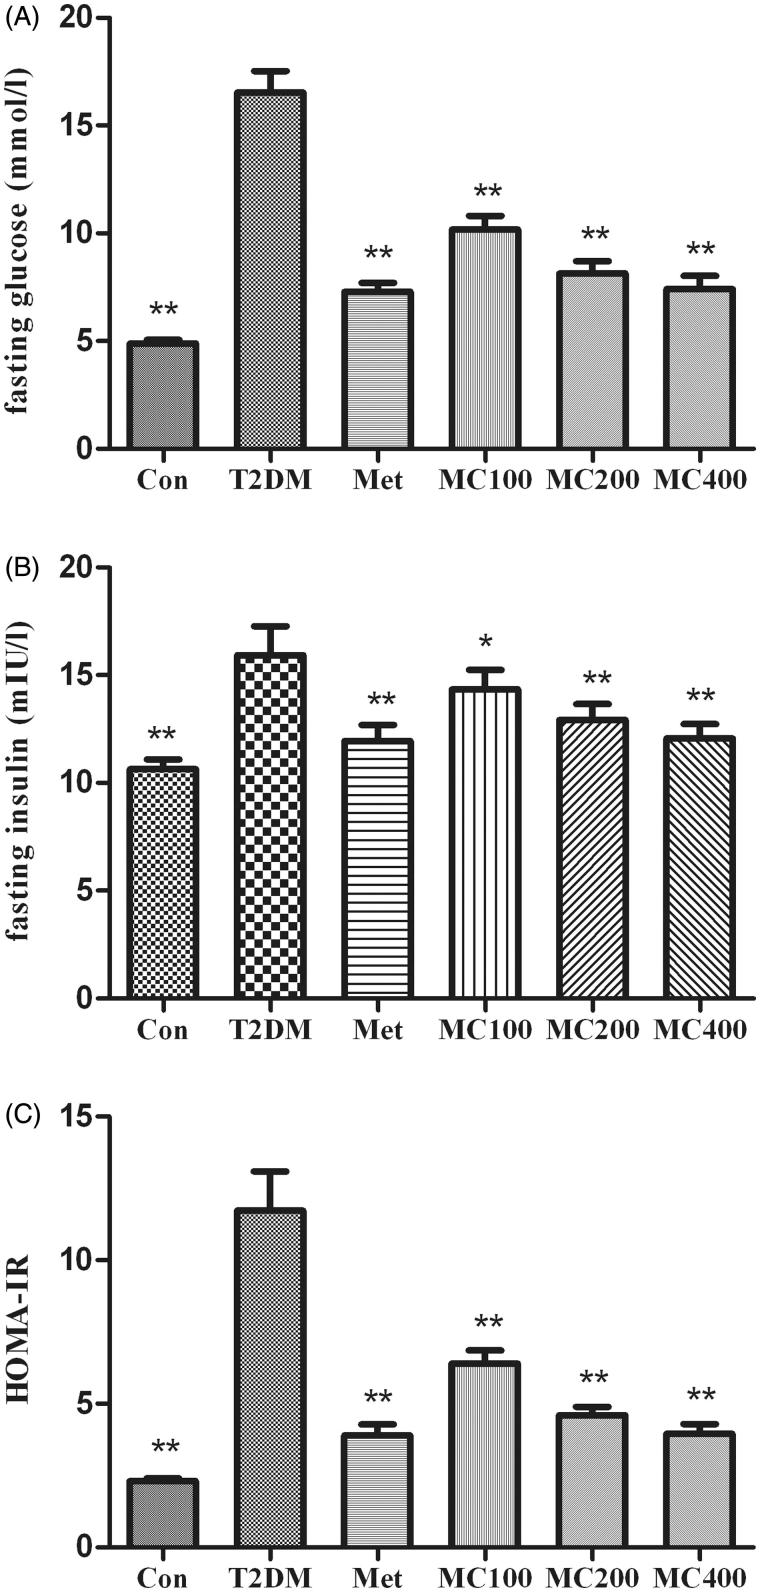
Figure 2.
The change of fasting serum glucose, insulin, and HOMA-IR. After 8 weeks treatment, following an overnight fasting, rats were sacrificed and the serum was assay. (A) fasting serum glucose, (B) fasting serum insulin, (C) HOMA-IR; Con: control; T2DM: Type 2 diabetes mellitus; Met: Metformin; MC100: MCE 100 mg; MC200: MCE 200 mg; MC400: MCE400 mg. *p < 0.05 and **p < 0.01 the T2DM group versus control and treated groups.

