
Figure 2.
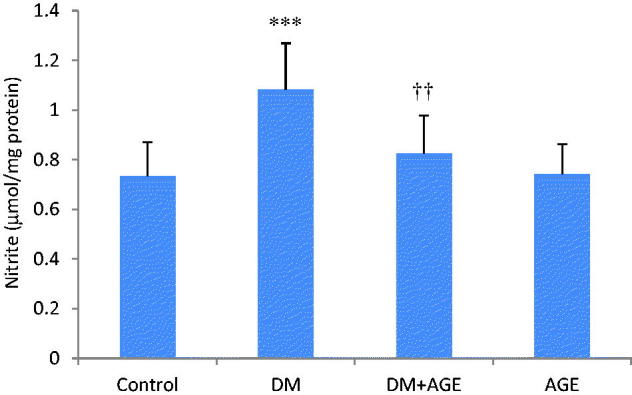
Nitrite levels in the kidney tissues of control rats, diabetic rats (DM), diabetic rats that treated with garlic extract (DM + AGE) and normal rats that received garlic extract (AGE). Results are mean ± SD (n = 6). ***p < 0.001 compare with control; ††p < 0.01 compare with DM.