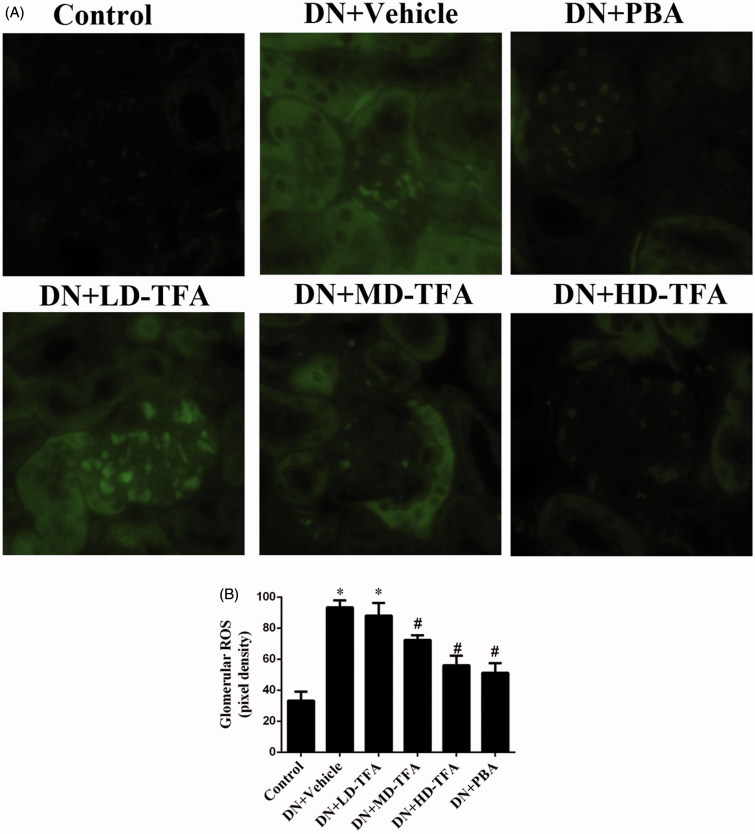
Figure 5.
Effect of TFA on kidney ROS production. (A) Representative 2′,7′-dichlorofluorescein (DCF) staining of hydrogen peroxide in the kidney (400×). (B) Quantification of the pixel density of DCF staining in glomeruli. The data are expressed as mean ± SD. *p < 0.05 vs. non-DN, #p < 0.05 vs. DN + vehicle, n = 10.

