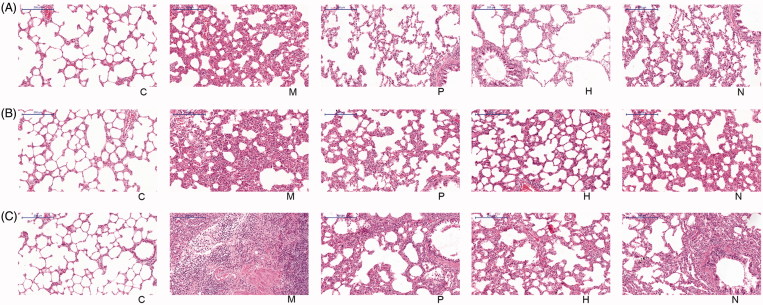
Figure 1.
Histopathological images of rat left lung tissues: (a) 15 days after drug treatment. (b) 30 days after drug treatment. (c) 45 days after drug treatment. C, the control group that is not induced into idiopathic pulmonary fibrosis; M, the model group that has been induced into idiopathic pulmonary fibrosis; P, the idiopathic pulmonary fibrosis model group that is treated by pirfenidone; H, the idiopathic pulmonary fibrosis model group that is treated by prednisone; N, the idiopathic pulmonary fibrosis model group that is treated by acetylcysteine. The scale bars were 200 μm.

