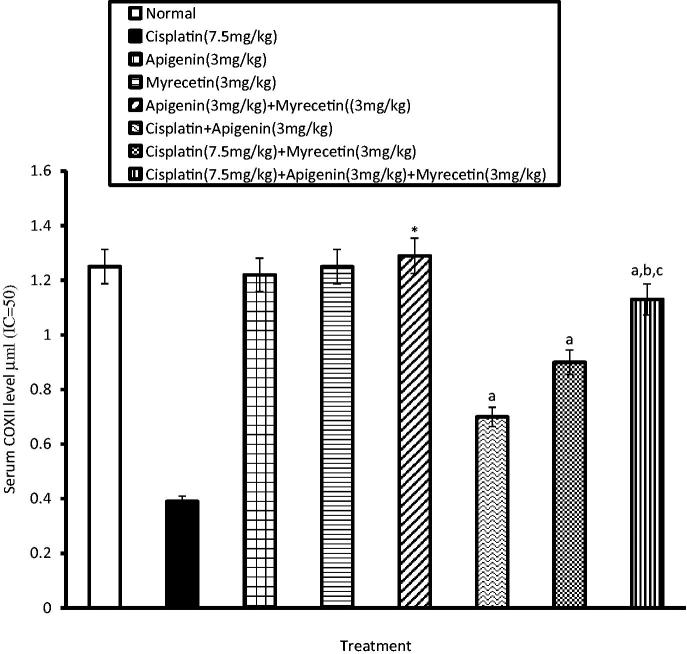
Figure 5.
Effects of apigenin, myricetin or their combination on serum COXII level. Data were expressed as mean ± SEM (n = 6–8). *Significantly different from the normal control group at p < 0.05. aSignificantly different from cisplatin group at p < 0.05. bSignificantly different from apigenin group at p < 0.05. cSignificantly different from myricetin group at p < 0.05.

