Figure 2.
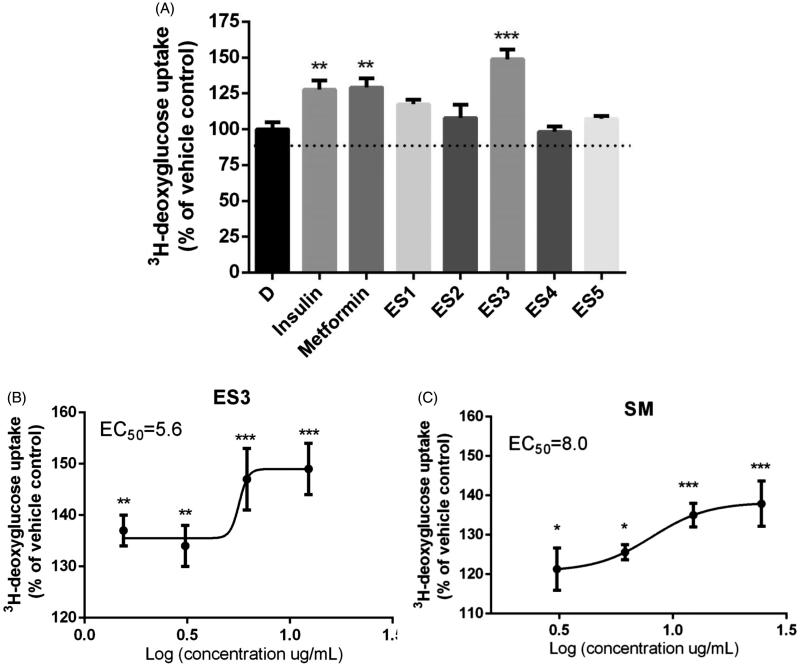
(A) Effect of E. sativa extracts on 3H-deoxyglucose uptake in C2C12 cells following 18 h treatment with their maximum non-toxic concentrations. Cells treated with insulin (100 nm, 30 min) or metformin (400 μM, 18 h) served as the positive control. (B) and (C) are dose-response analysis of the stimulation of glucose uptake by ES3 and SM, respectively. Cells were incubated with several concentrations of ES3 (1.56, 3.12, 6.25 and 12.5 μg/mL) or SM (3.12, 6.25, 12.5 and 25 μg/mL). Data are represented as mean ± SEM of three independent experiments and are expressed as % change in the rate of basal glucose uptakes relative to the vehicle control (0.1% DMSO). *p < 0.05, **p < 0.01, ***p < 0.001 significantly different from 0.1% DMSO.

