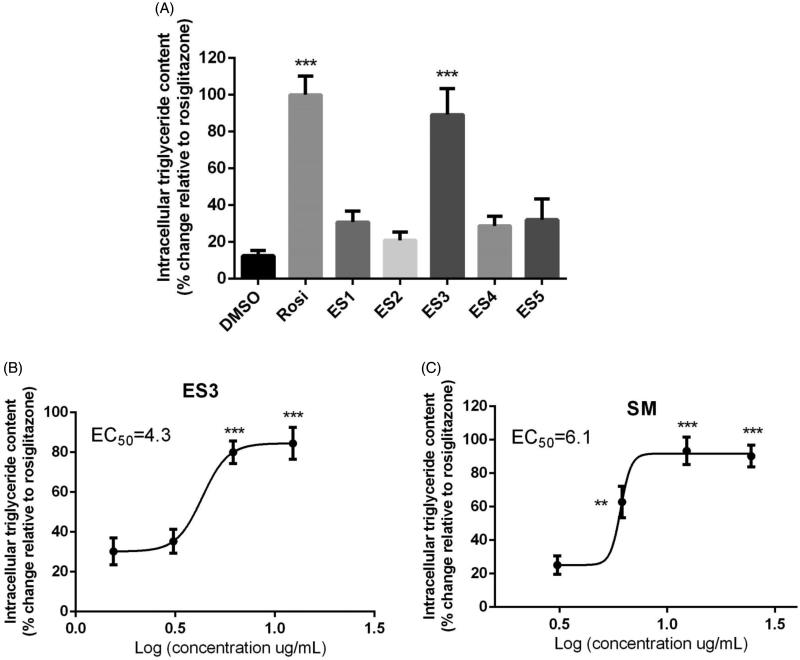
Figure 4.
(A) Adipogenic activity of E. sativa extracts tested at their maximum non-toxic concentrations in 3T3-L1 adipocytes, as assessed by triglyceride content at the end of differentiation period. Two-day post-confluent preadipocytes were incubated with the plant extracts on day 0 of differentiation for 8 day. (B) and (C) are dose-response analysis of the adipogenic activities of ES3 and SM, respectively. Cells were incubated with several concentrations of ES3 (1.56, 3.12, 6.25 and 12.5 μg/mL) or SM (3.12, 6.25, 12.5 and 25 μg/mL). Data are represented as mean ± SEM and are expressed as % change in intracellular triglyceride content relative to the positive control rosiglitazone (10 μM), which was set at 100%. Assays were carried out in triplicate. **p < 0.01 and ***p < 0.001 indicate a significant difference from vehicle control. Rosi: rosiglitazone.

