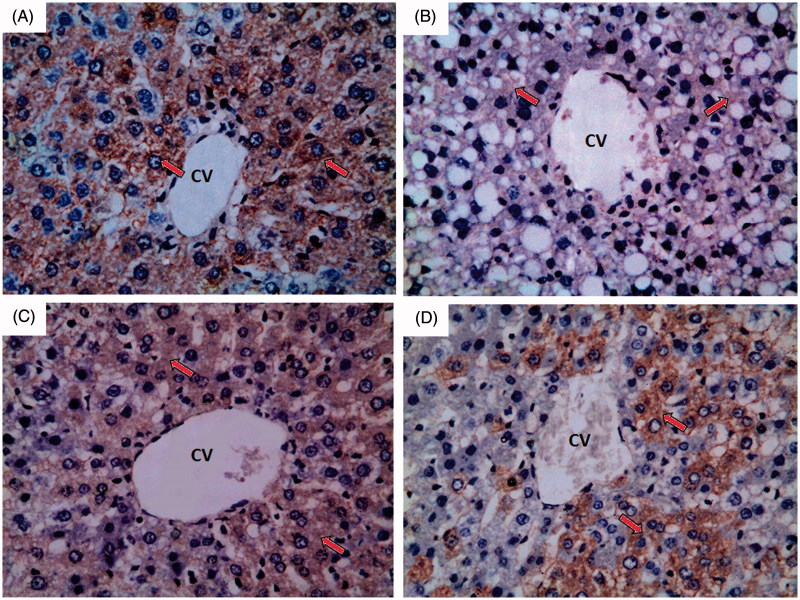
Figure 7.
A photomicrograph of liver section obtained from different groups (eNOS immunohistochemical stain; 400×), where (A) normal control group showing strong immunoreactivity to eNOS which appears as brown colour (red arrow); (B) ferrous sulphate group showing weak to negative immunoreactivity to eNOS which appears as brown colour (red arrow); (C) N-acetylcysteine plus ferrous sulphate group showing strong immunoreactivity to eNOS which appears as brown colour (red arrow) but not as normal control group; (D) saponin plus ferrous sulphate group showing moderate immunoreactivity to eNOS which appears as brown colour (red arrow).

