Figure 4.

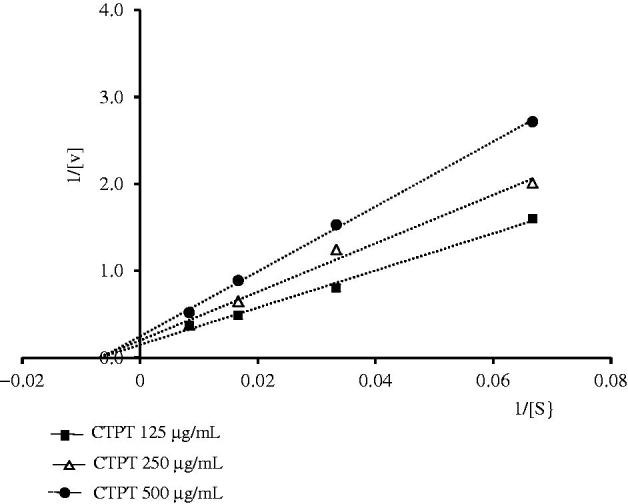
Lineweaver–Burk plots for the kinetic analysis of xanthine oxidase activity inhibited by CTPT extract. The (▪), (Δ), (•) represent CTPT extract at concentrations of 125, 250 and 500 µg/mL, respectively.

Lineweaver–Burk plots for the kinetic analysis of xanthine oxidase activity inhibited by CTPT extract. The (▪), (Δ), (•) represent CTPT extract at concentrations of 125, 250 and 500 µg/mL, respectively.