
Figure 4.
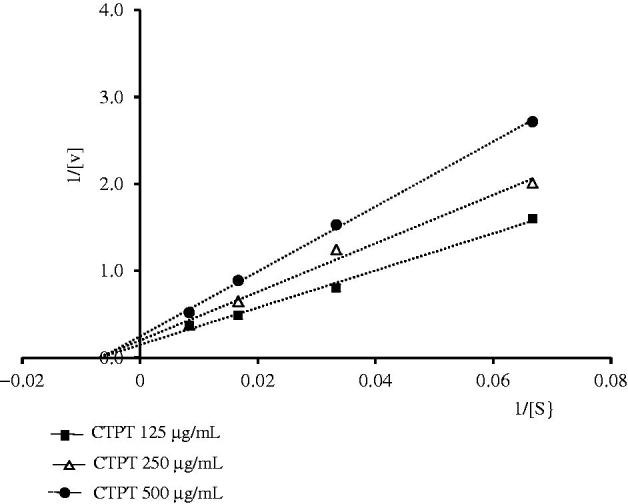
Lineweaver–Burk plots for the kinetic analysis of xanthine oxidase activity inhibited by CTPT extract. The (▪), (Δ), (•) represent CTPT extract at concentrations of 125, 250 and 500 µg/mL, respectively.
Official websites use .gov
A
.gov website belongs to an official
government organization in the United States.
Secure .gov websites use HTTPS
A lock (
) or https:// means you've safely
connected to the .gov website. Share sensitive
information only on official, secure websites.
Lineweaver–Burk plots for the kinetic analysis of xanthine oxidase activity inhibited by CTPT extract. The (▪), (Δ), (•) represent CTPT extract at concentrations of 125, 250 and 500 µg/mL, respectively.