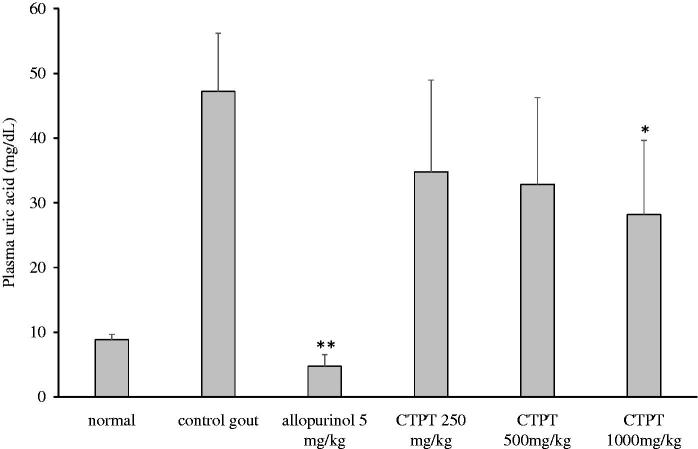
Figure 5.
Effect of CTPT extract on the plasma uric acid concentration in potassium oxonate-induced hyperuricemic mice. Group 1 represents the normal control group; group 2 is untreated potassium oxonate-induced hyperuricemic mice; group 3 is potassium oxonate-induced hyperuricemic mice treated with allopurinol (5 mg/kg); groups 4, 5 and 6 are potassium oxonate-induced hyperuricemic mice treated with 250, 500 and 1000 mg/kg CTPT extract, respectively. Data are expressed as the mean ± SEM (n = 6). * and ** indicate statistically significant differences at p < 0.05 and p < 0.01, respectively, when compared to group 2.

