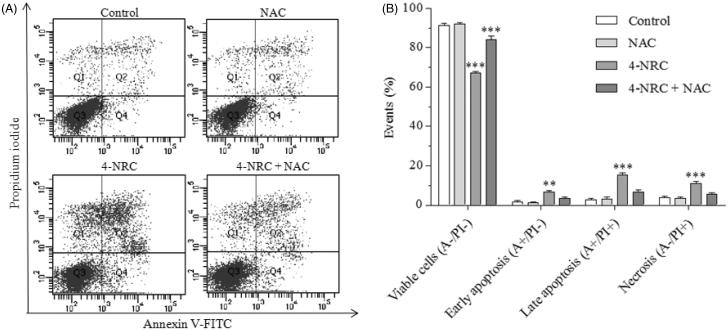
Figure 3.
Analysis of phosphatidylserine externalization profile in K562 cells after treatment with 4-NRC. The cells (1 × 10⁶ cells/mL) were treated with 4-NRC (27 μM) for 24 h and analyzed using a flow cytometer. Simultaneously, cell groups were also pretreated with N-acetyl-l-cysteine (NAC) antioxidant agent (2 mM) for 1 h following treatment with 4-NRC to evaluate the involvement of ROS in apoptosis induction. Representative distribution (A) and percentage (B) of necrotic cells in the upper-left quadrant (A-/PI+); early apoptotic cells in the lower-right quadrant (A+/PI-); late apoptotic cells in the upper-right quadrant (A+/PI+); and viable cells in the lower-left quadrant (A-/PI-) in control and 4-NRC groups. Each bar presents mean ± SD of three independent experiments (**p < 0.01 and ***p < 0.001 vs. control).

