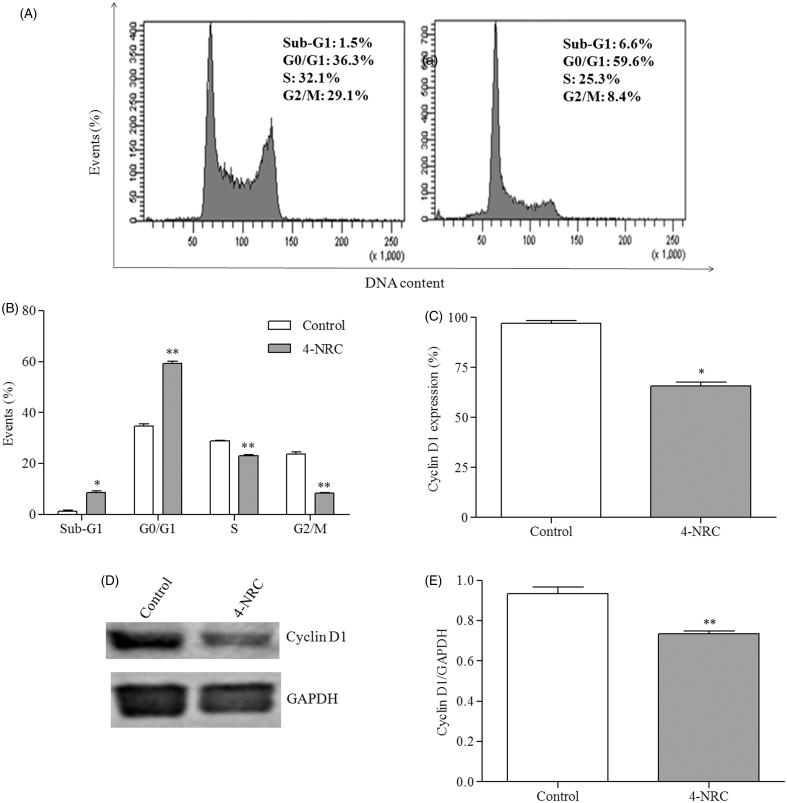
Figure 4.
Effects of 4-NRC on the cell cycle and cyclin D1 expression in K562 cells. (A) Representative histograms of the analysis of cell cycle in K562 cells following 24 h treatment with 4-NRC (27 μM). (B) Effects of 4-NRC on cell cycle progression, presented as the percentage of cells in the sub G1, G1, S and G2 phases. Flow cytometry (C) and western blot (D and E) cyclin D1 expression analysis in K562 following treatment with 4-NRC (27 μM) for 24 h. Values represent the means ± SD of two or three independent experiments (*p < 0.05 and **p < 0.001 vs. control).

