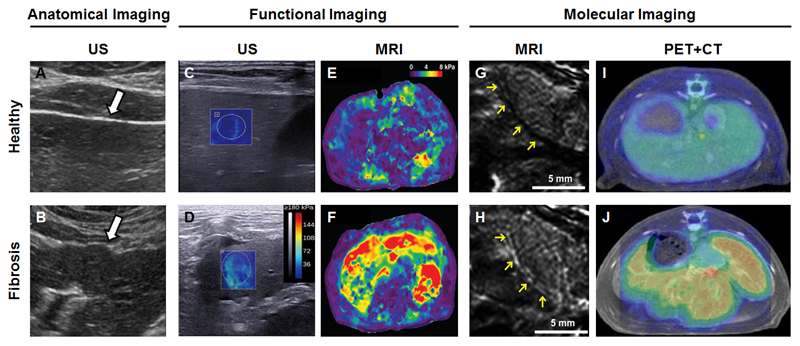
Figure 4.
Imaging of liver fibrosis. (A) Anatomical US imaging depicting the smooth surface of a healthy liver. (B) Anatomical US imaging in case of a fibrotic liver shows an irregularly shaped surface with clearly discernable nodules. (C) Shear wave US elastography of a healthy liver demonstrating low tissue stiffness. (D) High stiffness is detected in a fibrotic liver. (E-F) MRI-based elastrography highlighting the potential of discriminating liver steatosis (E) from a fibrotic liver (F) which typically shows a much higher tissue stiffness. (G-H) T1-weighted MRI upon the intravenous injection of the gadolinium-containing elastin-specific contrast agent ESMA showing no perivascular enhancement in healthy mouse liver (G) and relatively strong perivascular enhancement was observed in the perivascular regions of a fibrotic mouse liver (H). (I-J) The translocator protein-specific radiotracer 18F-FEDAC shows no detectable signal in PET-CT scans in the liver of healthy rats, while significant tracer accumulation is observed in the fibrotic livers of in CCl4-treated rats (J). Image adapted, with permission, from [103, 112, 116, 126, 132].

