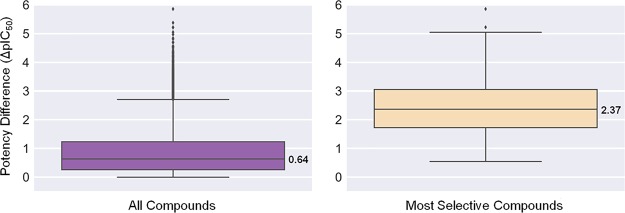
Figure 2.
Compound potency differences for kinase pairs. Boxplots report the distribution of potency differences of inhibitors for paired kinases as the mean potency difference of all inhibitors (left) or the largest potency difference (most selective compounds; right). The distributions yield ΔpIC50 median values of 0.64 (left) and 2.37 (right).

