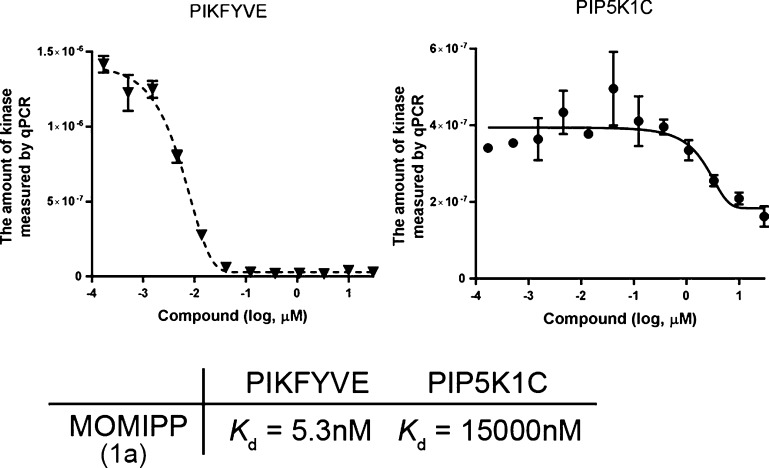
Figure 1.
Lipid kinase competition assay for PIKFYVE and PIP5K1C. Compound–kinase interactions were quantitated by quantitative PCR (qPCR) that detects the associated DNA label on each kinase as described in the Experimental Section. The amount of kinase measured by qPCR is plotted against the corresponding MOMIPP concentration. Binding constants (Kd) were calculated with a standard dose–response curve using the Hill equation12 as follows. Response = background + (signal – background)/(1 + (KdHill slope)/(doseHill slope)). The Hill slope was set to −1.

