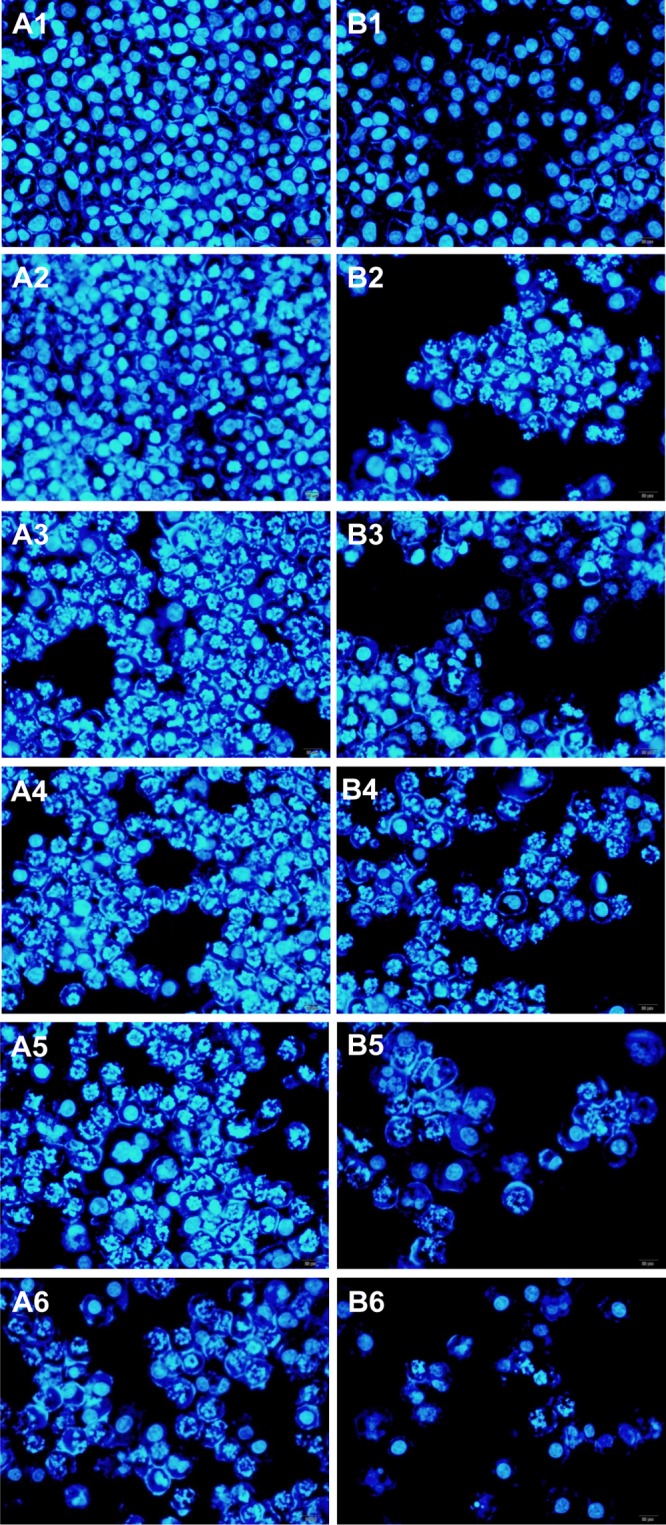
Figure 8.

Fluorescent microscopy images showing the cell cytotoxicity of free PTX (A1: control; A2: 1 nmol/L; A3: 5 nmol/L; A4: 10 nmol/L; A5: 50 nmol/L; A6: 100 nmol/L) and pGO-FA-PTX (B1: control; B2: 1 nmol/L; B3: 5 nmol/L; B4: 10 nmol/L; B5: 50 nmol/L; B6: 100 nmol/L) by A2780 cells (at the same concentration of PTX) for 24 h.
