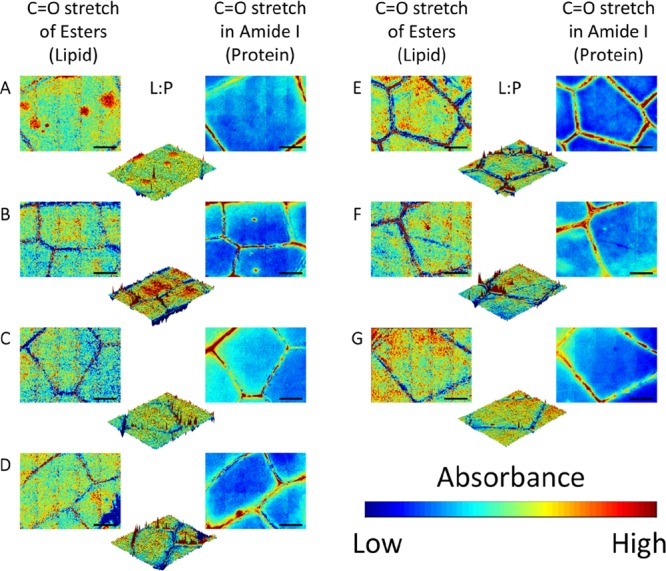
Figure 1.

Chemical compositions of the wing membranes of seven species of dragonfly from three families, characterized through FTIR microspectroscopy. (A) Austrothemis nigrescens, (B) Orthetrum chrysostigma, (C) Trithemis annulata, (D) Sympetrum fonscolombii, (E) Anax parthenope, (F) Anax imperator, and (G) Onychogomphus forcipatus. In the 2D contour plots, lipid and protein distributions were determined through absorbance at the C=O stretching band (1750–1720 cm–1) and amide I band (1705–1600 cm–1), respectively. The red areas represent higher absorbance in the bands and thus higher concentrations, whereas the blue areas represent lower concentrations. The three-dimensional (3D) contour plots of the lipid/protein ratio show the areas of relatively higher lipid concentration in red and areas of higher protein concentration in blue. Scale bars = 200 μm.
