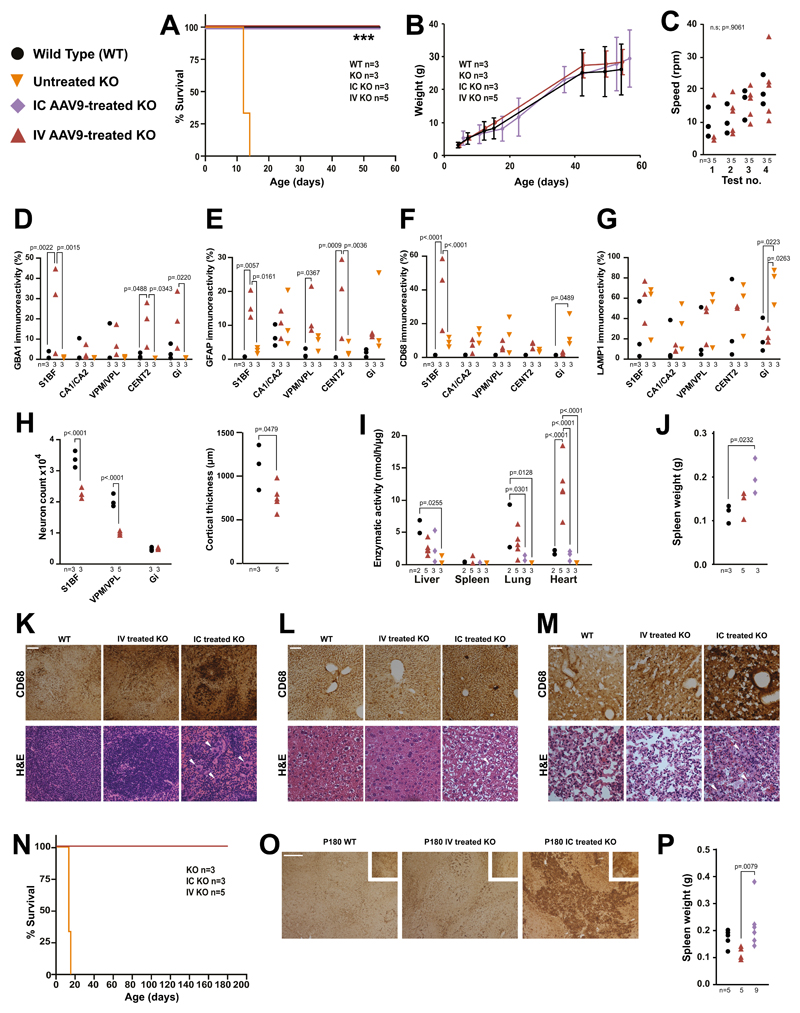
Fig. 3. Intracerebroventricular and intravenous gene therapy in neonatal nGD mice.
(A) Kaplan-Meier survival plot of untreated knockouts, IC gene therapy treated knockouts, IV gene therapy treated knockouts and WTs (Logrank, Mantel-Cox test). (B) Weights of mice from (A). (C) Rotarod assessment of mice from (A) (repeated measures ANOVA). Immunohistochemistry for GBA1 (D), GFAP (E), CD68 (F) and LAMP1 (G) in brains of 55 day old treated knockout and WTs and P12 untreated knockouts in the S1BF, hippocampal cornu ammonus 1 (CA1), the cerebellar central lobule II (CENT2) and Gi (2-way ANOVA, Tukey’s multiple comparisons). (H) Neuron counts in the Gi, S1BF and VPM/VPL in treated knockouts and WTs and cortical thickness measurements (2-way ANOVA, Tukey’s multiple comparisons). (I) GCase activity in organs of treated knockouts, WTs, and untreated P12 knockouts (2-way ANOVA, Tukey’s multiple comparisons). (J) Spleen weights from mice receiving gene therapy and WTs (1-way ANOVA, Tukey’s multiple comparisons). Haemotoxylin and eosin staining and CD68 immunohistochemistry of (K) spleens, (L) livers and (M) lungs from intravenously and intracerebroventricularly gene therapy treated and WT mice (white arrows highlight Gaucher cells, scale bar = 0.1mm). (N) Kaplan-Meier survival plot of long-term gene therapy treated and untreated knockouts (Mantel-Cox test). (O) CD68 immunohistochemistry on spleens from (N) and WTs (scale bar = 0.25mm). (P) Spleen weights from (O) (1-way ANOVA, Tukey’s multiple comparisons). Numbers of mice are stated under each group. n.s. = not significant

