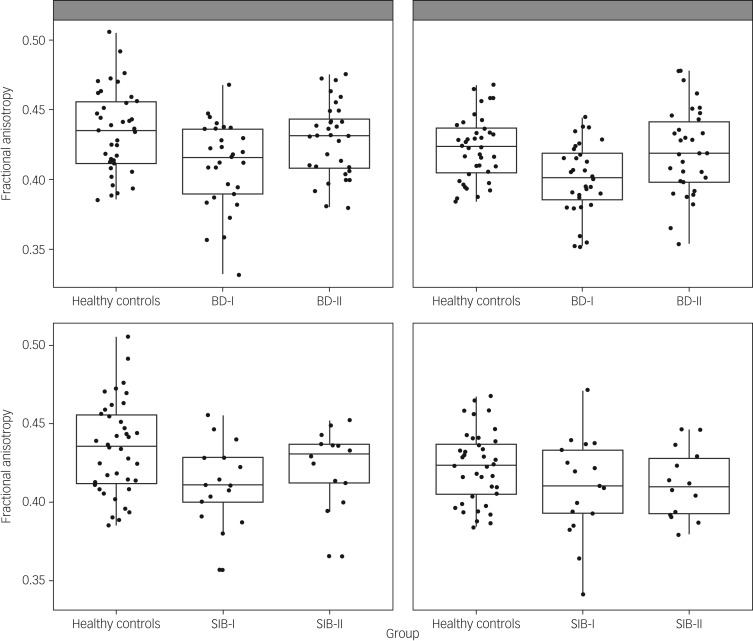
Fig. 1.
Scatterplot presenting fractional anisotropy values across healthy controls and participants with bipolar disorder type I (BD-I), type II (BD-II) (top panel), and unaffected siblings of bipolar type I (SIB-I) and type II (SIB-II) participants (bottom panel). Figures on the left correspond to the left uncinate fasciculus, figures on the right to the right uncinate fasciculus.

