Figure 3.

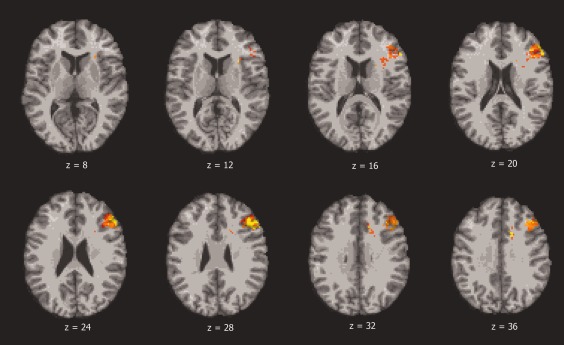
Color indicates brain regions where the association between voxel lesion location and apathy score is statistically significant, based on t‐tests and after correction for multiple comparisons (FDR). The left is on the viewer's right.

Color indicates brain regions where the association between voxel lesion location and apathy score is statistically significant, based on t‐tests and after correction for multiple comparisons (FDR). The left is on the viewer's right.