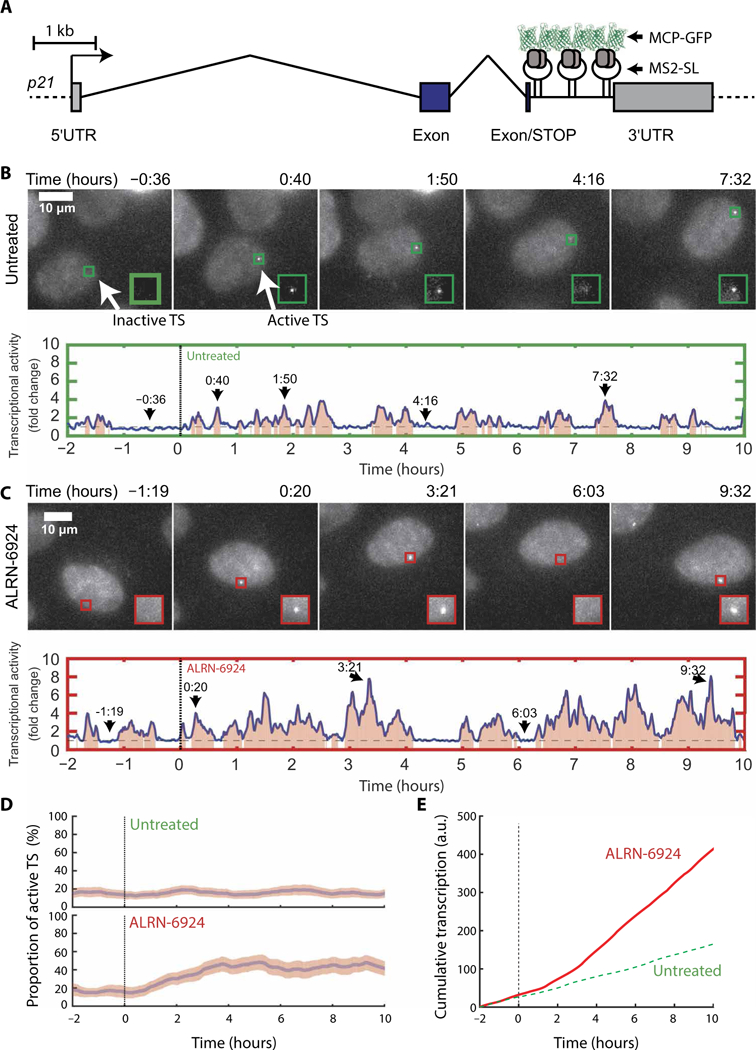
Fig. 2. ALRN-6924 rapidly increases transcription at the p21 locus and affects its bursting dynamics.

(A) Schematic representation of the engineered p21 gene locus containing MS2 stem-loops (p21-MS2). The transcription start site is shown as an arrow, exons are shown as blue rectangles, introns are shown as angled lines, and 5’ and 3’ untranslated regions (UTRs) are in gray. Scale bar, 1 kb. (B) Live-cell imaging of U2OS p21-MS2 cells in untreated medium. Top panel: Images of cells containing p21-MS2 (maximum intensity projections of z-dimension stacks). Scale bar, 10 μm; the green box outlines the transcription site (TS). Bottom panel: Quantification of the fluorescence intensity at the TS marked in the top panel. (C) Live-cell imaging of U2OS p21-MS2 cells in ALRN-6924-treated medium as described in (B). (D) Proportion of cells containing an active TS (>1.5-fold the background). For each time point and condition, the proportion of active TS in a cell population was calculated using a rolling average of 30 min before and after each time point [85 untreated cells (top) and 54 cells treated with 5 μM ALRN-6924 (bottom)]. The pink area represents the 95% confidence interval. (E) Average cumulative transcription plot of p21-MS2 gene in untreated (green broken lines) versus ALRN-6924-treated cells (red solid lines). MCP-GFP, green fluorescent protein-tagged MS2 capsid protein; a.u., arbitrary units.
