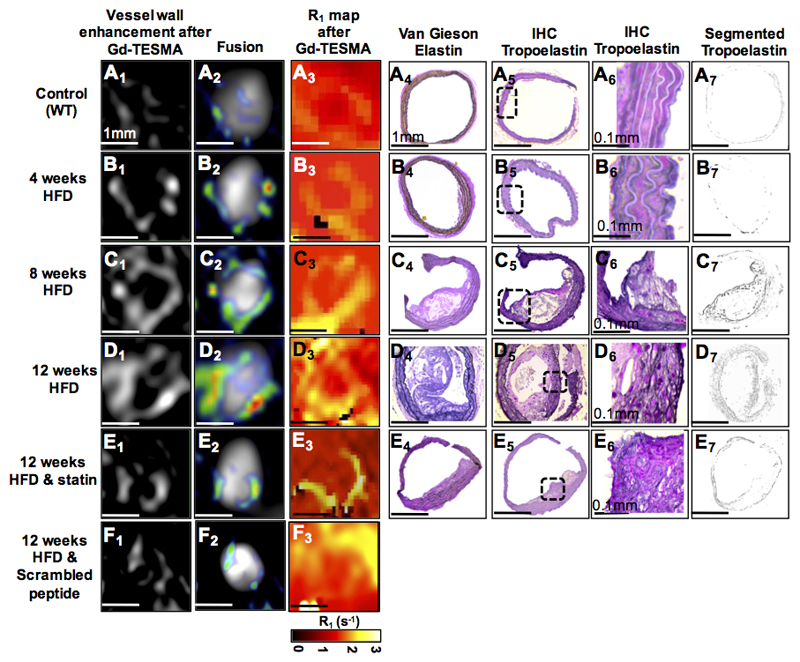
Figure 4. Molecular in vivo MRI of tropoelastin in atherosclerotic mice.
A1-E1 & A2-E2 & A3-E3, DE-MRI images and R1 relaxation rate maps after injection of Gd-TESMA show progressive enhancement of the brachiocephalic artery and vessel wall relaxation rate with disease progression compared with control and statin-treated mice. F1-F3, DE-MRI and R1 maps after injecting the scrambled peptide (DOTA-GAESAPLVSSVQSPD) shows less vessel wall enhancement and relaxation rate. A4-E4, Van Gieson elastin staining shows the development of atherosclerotic lesions. A5-E5, A6-E6 and A7-E7, Immunohistochemistry shows accumulation of tropoelastin molecules (dark purple staining) in the lesion (n=10 per group). DE-MRI: delayed-enhanced MRI, TESMA: tropoelastin-specific MR contrast agent, HFD: high-fat diet.

