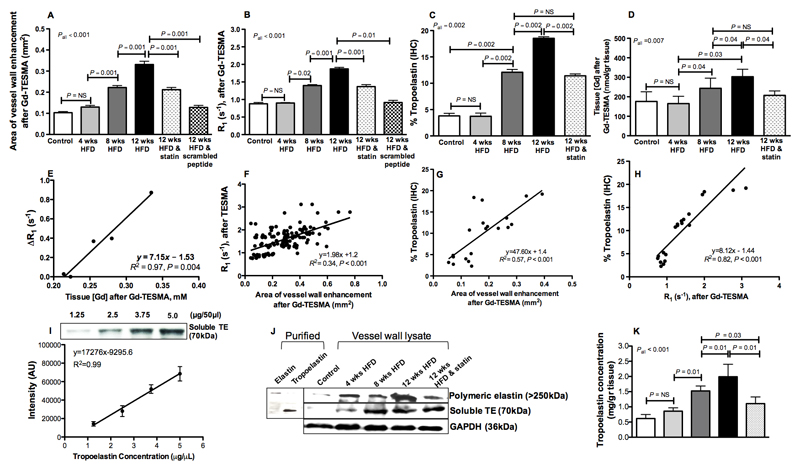
Figure 5. Quantitative MRI, histology and western blotting of murine vessel wall tropoelastin.
A-B, DE-MRI area and vessel wall R1 measured after administration of Gd-TESMA increase with disease progression and decrease with statin-treatment (n=10 per group). C, Tropoelastin accumulates during atherosclerosis progression and reduces in statin-treated mice (n=4 per group). D, Vessel wall gadolinium concentration increases with disease progression (n=4 per group). E, The measured in vivo bound relaxivity of TESMA is r1=7.15 mM-1s-1. F, DE-MRI area correlates with vessel wall R1 measured after administration of Gd-TESMA (n=10 per group). G-H, The tropoelastin content measured histologically correlates with both the DE-MRI (G) and vessel wall R1 relaxation rate (H) measured by MRI after administration of Gd-TESMA (n=4 per group). I, Dilutions of recombinant human tropoelastin were used to generate a standard curve for the quantification of the tropoelastin concentration from tissue lysates using western blotting. J, Western blotting of purified elastin showed that cross-linked elastin is an insoluble polymer with a high molecular band (>250kDa) whereas soluble tropoelastin has a molecular weight at 70kDa. Western blotting for tropoelastin extracted from the vessel wall (n=3 per group) showed negligible amounts in control arteries and increased deposition of the protein during atherosclerosis progression in ApoE−/− mice. Tropoelastin content was decreased in the statin-treated ApoE−/− mice. K, Quantification of tropoelastin concentration in control and diseased arteries as measured by western blotting.

