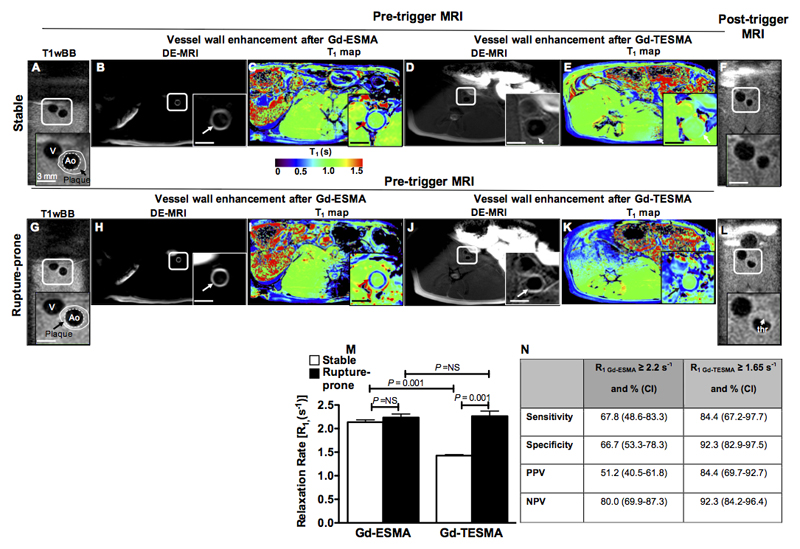
Figure 6. In vivo molecular MRI of tropoelastin allows detection of rupture-prone rabbit plaque.
Pre-trigger and post-trigger MRI images of rabbit stable (A-F) and rupture-prone (G-L) plaques. A,G, Pre-trigger native zoom T1wBB images show the plaque. B, H, C, I, Delayed-enhanced inversion recovery images and T1 maps after administration of Gd-ESMA show a strong enhancement of the aortic wall and shortening of the T1 relaxation time in both stable and rupture-prone plaque. D, J, E, K, Corresponding delayed-enhanced inversion recovery images after administration of Gd-TESMA show vessel wall enhancement and lower T1 values in ruptured-prone compared with stable plaque. F, L, Corresponding native zoom T1wBB post-trigger images show the presence of thrombus only at the side of the ruptured plaque. M, Quantification of vessel wall R1 relaxation rate show a significantly higher R1 value in rupture-prone compared with stable plaque only after administration of Gd-TESMA.

