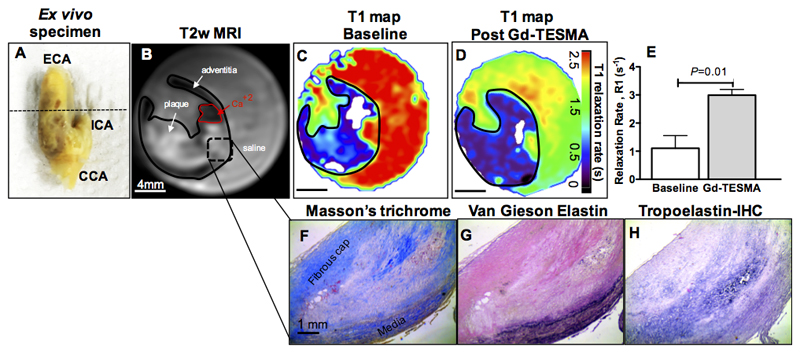
Figure 8. Ex vivo T1 mapping experiments using human carotid endarterectomy specimens at 3T.
A, Ex vivo photograph of an excised left carotid artery. B-C, A T2w image shows the plaque in the internal carotid artery (B) and a corresponding T1 map shows the baseline relaxation values (C). D, A repeated T1 mapping experiment after soaking the specimen in Gd-TESMA shows a reduction of the T1 values. E, Quantification of the changes shows a significant uptake of Gd-TESMA in human carotid plaques. F-G, Corresponding histology shows the lesion (F-G) and the deposition of tropoelastin (dark purple staining) (H).

