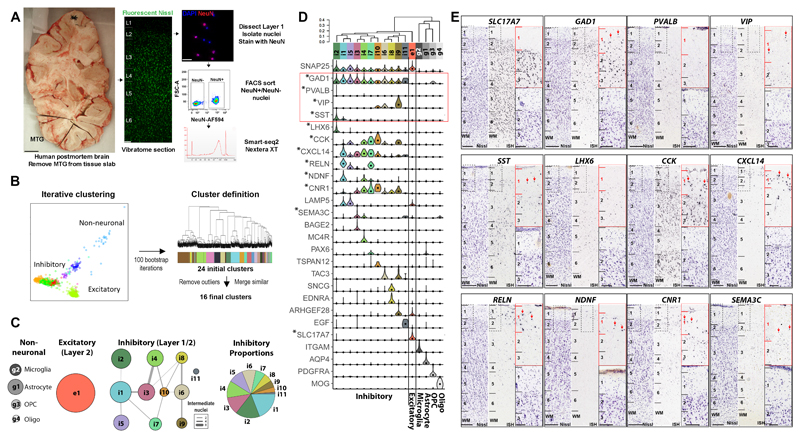
Figure 1. Identification of transcriptomic cell types in layer 1 of human temporal cortex.
A, Isolation of single nuclei from post-mortem adult human cortex for RNA-sequencing. Scale bars, left 1 cm, right, 20 µm. B, Left: Nuclei were grouped based on similar gene expression profiles using an automated iterative clustering procedure. Clustering was repeated 100 times on random subsets of 80% of nuclei. Right: Hierarchical clustering of nuclei that were consistently co-clustered across iterations identified 24 clusters. 16 clusters remained after removal of clusters associated with quality control metrics and merging of clusters that lacked at least one binary marker gene. C, 4 non-neuronal, 1 excitatory and 11 inhibitory neuron clusters were identified, although the excitatory cluster and one inhibitory cluster were likely in Layer 2 due to incidental capture superficial layer 2 with Layer 1 dissection. For each cluster, the constellation diagram shows the cell type class (based on canonical marker gene expression), relative frequency (disc area), and discreteness (line thickness proportional to the number of nuclei with ambiguous cluster membership) of clusters. D, Clusters arranged by transcriptomic similarity based on hierarchical clustering, with the expression distributions of selective marker genes shown across clusters as violin plots. Expression is on a linear scale and dots indicate median expression. Cluster sample sizes: i2 (n=77); i1 (n=90); i5 (n=47); i3 (n=56); i4 (n=54); i7 (n=31); i10 (n=16); i6 (n=44); i8 (n=27); i9 (n=22); i11 (n=6); e1 (n=299); g2 (n=27); g1 (n=48); g3 (n=18); g4 (n=9). E, ISH of select marker genes in human temporal cortex at low magnification (left columns with near adjacent Nissl stain for cytoarchitectonic laminar identification) and high magnification in layers 1-3 (right column). Red arrows highlight cells expressing genes in layer 1. Note that LHX6 marks a single cluster (i2) that is not expressed in layer 1 and therefore nuclei in this cluster were likely sampled from upper layer 2. Other clusters are restricted to layer 1 (e.g. NDNF+) or may be distributed across layers 1 and 2. Scale bars=250 µm (low mag), 100 µm (high mag). ISH experiments were conducted on multiple tissue donors as follows: SLC17A7, LHX6, CNR1, SEMA3C (n=3); CXCL14 (n=5); GAD1, CCK, RELN, NDNF (n=6); SST (n=7); PVALB (n=8); VIP (n=10).

