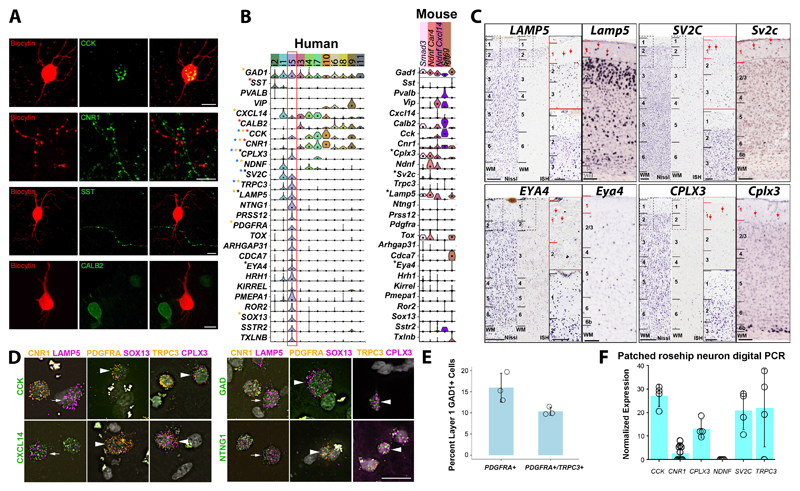
Figure 3. Molecular phenotype of rosehip cells in layer 1 of the human cerebral cortex.
A, Whole cell recorded and biocytin (red) filled RCs shows CCK (green; n=10) immunopositivity. All biocytin (red) labeled RCs tested for CB1 cannabinoid receptors (CNR1; n=11), somatostatin (SST; n=9), and calretinin (CALB2; n=2) were immuno-negative in spite of having labeled cells in the vicinity. Scale bars, 10 µm. B, Violin plots of gene expression for broad cell type and putative rosehip specific markers. Expression is on a linear scale and dots indicate median expression. Cluster sample sizes: i2 (n=77); i1 (n=90); i5 (n=47); i3 (n=56); i4 (n=54); i7 (n=31); i10 (n=16); i6 (n=44); i8 (n=27); i9 (n=22); i11 (n=6); Smad3 (n=12); Ndnf Car4 (n=24); Ndnf Cxcl14 (n=30); Igtp (n=10). Expression validated for select genes by immunohistochemistry (red stars), colorimetric ISH (black), multiplex FISH (orange), and single cell digital PCR (blue) in morphologically identified RCs. C, ISH of select marker genes in human temporal cortex (left) and mouse cortex (right). Red arrows highlight cells expressing genes in layer 1. Scale bars=250 µm (low mag), 100 um (high mag). ISH experiments were repeated on multiple human donors as follows: LAMP5 (n=2); EYA4, CPLX3 (n=3); SV2C (n=5). For mouse, ISH experiments were repeated on multiple specimens as follows: Lamp5, Sv2c, Cplx3 (n=2); Eya4 (n=3). D, Multiplex FISH validation of rosehip marker co-expression. Arrowheads and arrows show examples of RCs that are triple- and double-positive (i.e. CNR1-), respectively, for marker genes based on RNA-Seq expression data. Scale bar=25 µm. Multiplex FISH experiments were repeated on n=2 tissue donors. E, RCs comprise 10-15% of layer 1 interneurons based on multiplex FISH quantification of 408 GAD1+ cells in 2 subjects. 15% (+/- 3) of GAD1+ cells express the rosehip specific marker PDGFRA, although a small fraction of these cells may be oligodendrocyte precursor cells (see Suppl. Fig.5). 10% (+/-1) of GAD1+ cells express PDGFRA and a second rosehip marker TRPC3, although some RCs may lack TRPC3 expression based on RNA-seq. Error bars represent standard deviation. Cell counts were conducted on n=3 tissue sections from n=2 tissue donors. F, Expression of rosehip cluster markers in cytoplasm of whole cell recorded RCs. Quantified by single cell digital PCR and reported as a percentage of housekeeping gene (TBP) expression in n=9 cells (CNR1) or n=4 cells (CCK, CPLX3, NDNF, SV2C, TRPC3) per gene. Note that NDNF expression was not detected in any of the cells tested. Columns and error bars represent mean and standard deviation.

