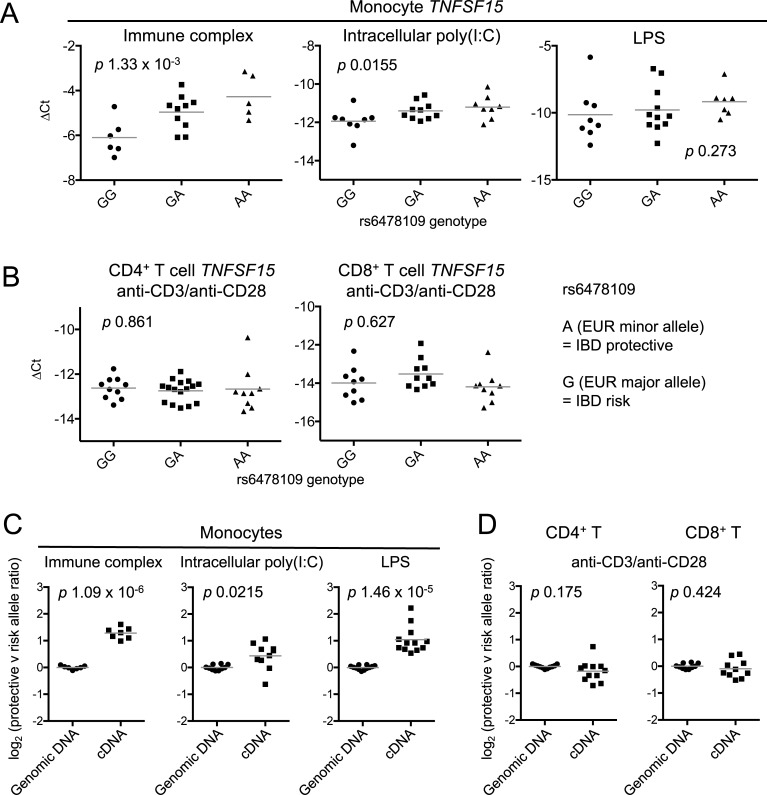
Fig 2. Monocyte but not T cell TNFSF15 expression is associated with genotype after stimulation.
(A) TNFSF15 mRNA expression was measured relative to B2M in monocytes stimulated for 4 hours with immune complex (rs6478109 genotype: GG, n = 6; GA, n = 10; AA, n = 5), intracellular poly(I:C) (GG, n = 8; GA, n = 10; AA, n = 8), or LPS (GG, n = 8; GA, n = 11; AA, n = 7). Expression is reported as ΔCt, each point represents an individual, lines represent mean values, and p values are from linear regression. (B) As (A) for CD4+ (GG, n = 10; GA, n = 16; AA, n = 9) and CD8+ (GG, n = 9; GA, n = 10; AA, n = 9) T cells stimulated for 24 hours. (C) Allelic ratios in cDNA from stimulated cells from heterozygous individuals are compared with those in genomic DNA from the same individuals: monocytes stimulated with immune complex (n = 7), intracellular poly(I:C) (n = 10) and LPS (n = 12), and (D) anti-CD3/anti-CD28-stimulated CD4+ (n = 11) and CD8+ (n = 10, genomic DNA as for panel (C) intracellular poly(I:C)) T cells. Ratios for immune complex- and LPS-stimulated monocytes and stimulated CD4+ T cells were measured using tag SNP rs4246905 (ratio of T/C reported), while ratios for poly(I:C)-stimulated monocytes and stimulated CD8+ T cells were measured using tag SNP rs4263839 (ratio of A/G reported). All individuals were heterozygous at both rs6478109 and the tag SNP. rs4263839:A and rs4246905:T are in phase with the IBD-protective allele rs6478109:A in 1000 Genomes EUR subjects. Lines represent mean values and p values are from Welch’s t-test.

