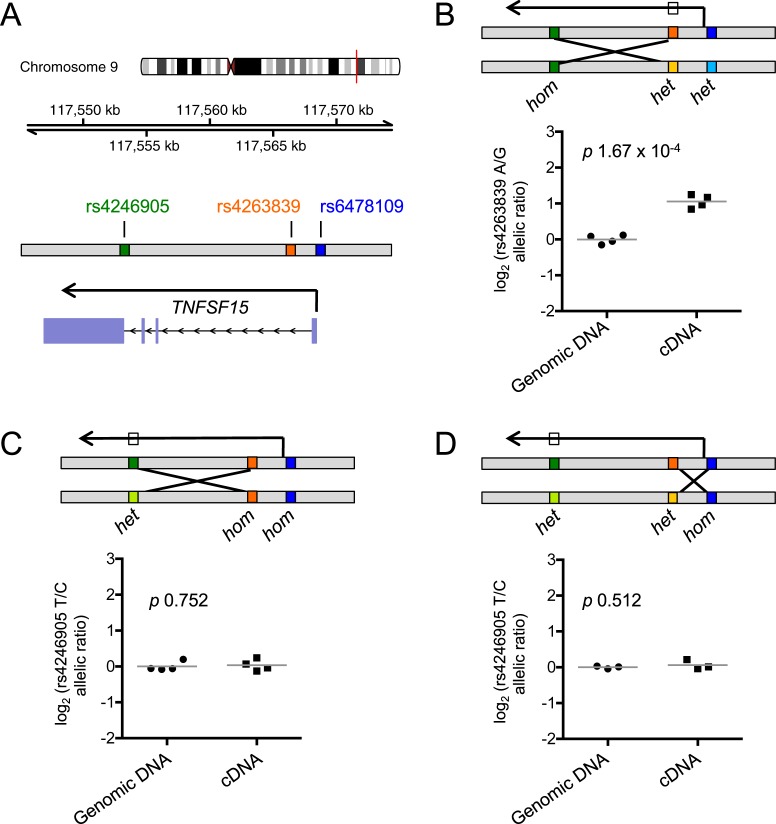
Fig 4. The eQTL causal SNP resides upstream of TNFSF15.
(A) The TNFSF15 locus on chromosome 9 is depicted, marking SNPs used for functional fine-mapping. (B) Immune complex-stimulated monocytes from individuals heterozygous at rs6478109 and rs4263839 but homozygous at rs4246905 (n = 4) were examined for allele-specific expression. The box on the transcription arrow indicates the SNP used for measuring allelic imbalance. (C) As (B) with individuals homozygous at rs6478109 and rs4263839 but heterozygous at rs4246905 (n = 4). (D) As (B) with individuals homozygous at rs6478109 but heterozygous at rs4263839 and rs4246905 (n = 3). Lines represent mean values and p values are from Welch’s t-test.

