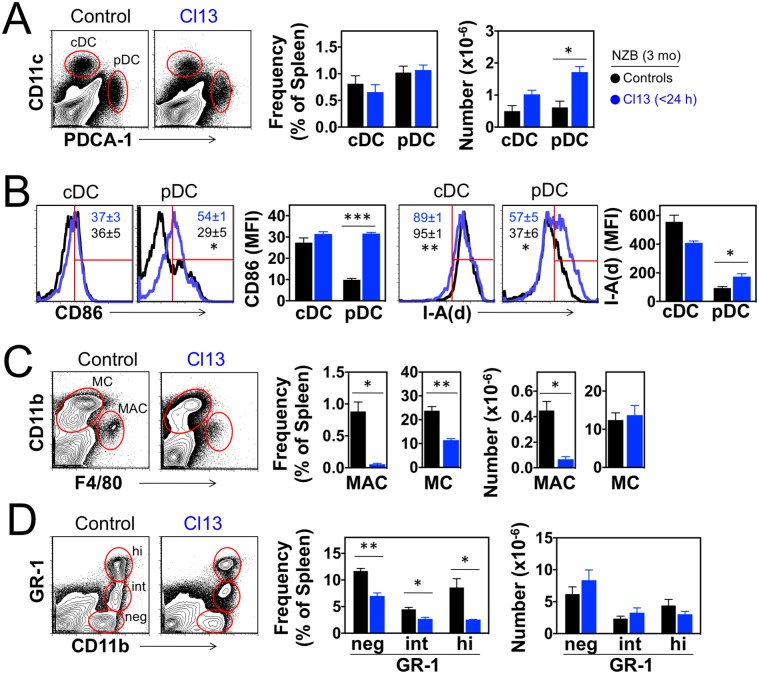
Fig 5. Expansion of activated pDCs in NZB mice neonatally infected with LCMV.
Mice were infected <24 h after birth with LCMV Cl13 and spleen cells analyzed at the age of 3 mo. Uninfected mice were used as controls. (A) Frequency and number of cDCs (CD11c+ PDCA-1−) and pDCs (CD11clow PDCA-1+) identified by FACS in gated live spleen cells (n = 3 mice). (B) Activation status of cDCs and pDCs indicated by expression levels of CD86 and MHC class II (I-Ad) molecules measured by FACS as mean fluorescence intensity (MFI). Numbers within FACS histograms indicate percent (± standard deviation) of CD86+ and I-A(d)hi cells in spleen of Cl13-infected (blue) or uninfected (black) mice (n = 3 mice). (C) Frequency and number of macrophages (CD11c− CD11blow F4/80+) and monocytes (CD11c− CD11b+ F4/80−) identified by FACS in gated live spleen cells (n = 3 mice). (D) Frequency and number of CD11b+ monocyte subsets defined by Gr-1 marker expression in gated CD11c− F4/80− spleen cells (n = 3 mice). Data are representative of 2 independent experiments. Error bars indicate standard deviation and asterisks statistical significance (*, p<0.05; **, p<0.01; ***, p<0.001).

