
Fig 2. Humoral immune response against Pv12.
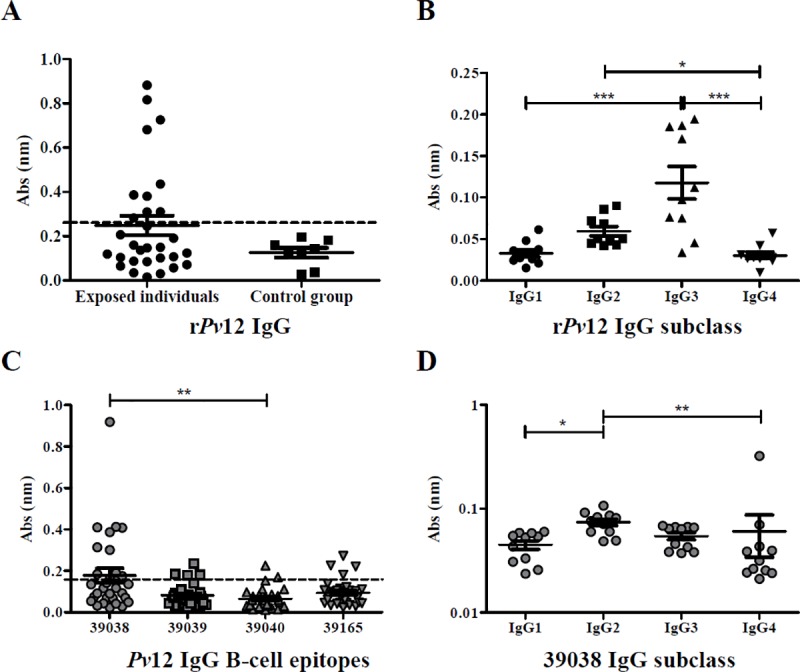
A. IgG antibody response against rPv12. Seropositive samples (n = 30) were those above the cut-off point (0.260, dotted line), calculated as control group’s mean plus two standard deviations. B. Analysing IgG subclass response to rPv12. The Kruskal-Wallis test was used for analysing differences between each IgG subclass response in P. vivax-exposed individuals’ samples. C. IgG antibody response against Pv12 B-cell epitopes (n = 30). Seropositive samples were those above the cut-off point (0.159, dotted line), calculated as control group’s mean plus two standard deviations. D. Evaluating IgG subclass response to the 39038 epitope (n = 11). The Kruskal-Wallis test was used for analysing differences between each IgG subclass response in P. vivax-exposed individuals’ samples. (*) p<0.05, (**) p<0.005 and (***) p<0.0005.