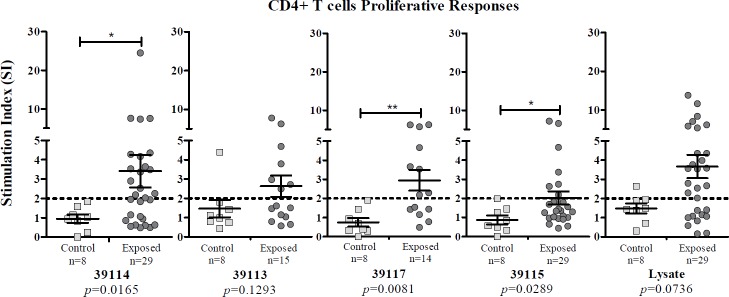
Fig 5. Lymphocyte proliferative response to Pv12 epitopes from individuals exposed to P. vivax infection compared to control group.
UP 39114 (n = 29); DRβ1*04 and DRβ1*11 GBP 39113 (n = 15); DRβ1*07 and DRβ1*13 GBP 39117 (n = 14); LBP / control 39115 (n = 29) and P. vivax lysate (n = 29) responses are shown. Mann-Whitney and Student’s t-tests were used for assessing statistically significant differences between exposed individuals and control group responses. (*) p<0.05 and (**) p<0.005.

