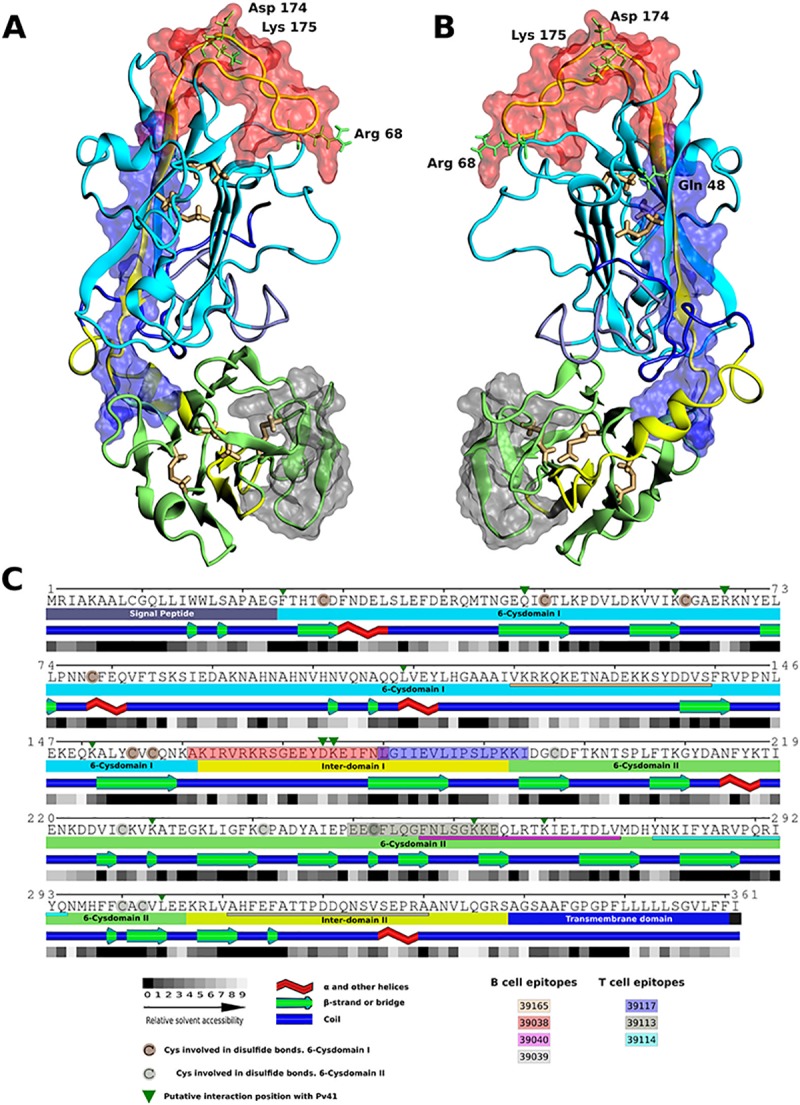
Fig 8. Pv12 structure model.

A (top view) and B (bottom view). Pv12 3D homology model. B-cell epitope 39038 (red) and T-cell epitopes 39117 (blue) and 39113 (grey) are shown as transparent surfaces. Potential interacting positions with Pv41 are shown in green and conserved Cys residues in yellow. C. Pv12 regions and primary/secondary structure representation, including relative solvent accessibility and potential interacting residues with Pv41 (green triangles). Best epitopes are shown (39038- red box, 39117-blue box, 39113-gray box). Other B- and T-cell epitopes are underlined. Conserved cysteine residues are shaded in brown.
