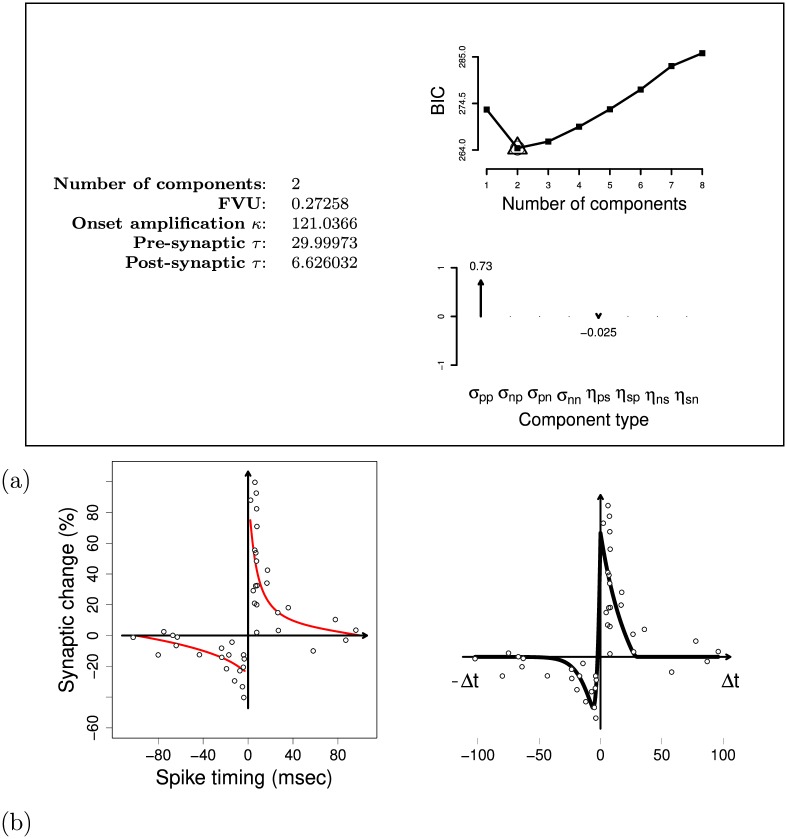
Fig 8. Results of the model comparison and fitting procedures used to regress the classic STDP data set from Bi and Poo [25].
(a) Data on the left: regression results. Top-right graph: BIC values obtained using 1 to 8 G-DHL components. Bottom-right graph: size of the parameters of the selected components. (b) Left graph: data points and exponential regression from [46] (reproduced from data). Right graph: G-DHL fit using the parameters in ‘a’.

