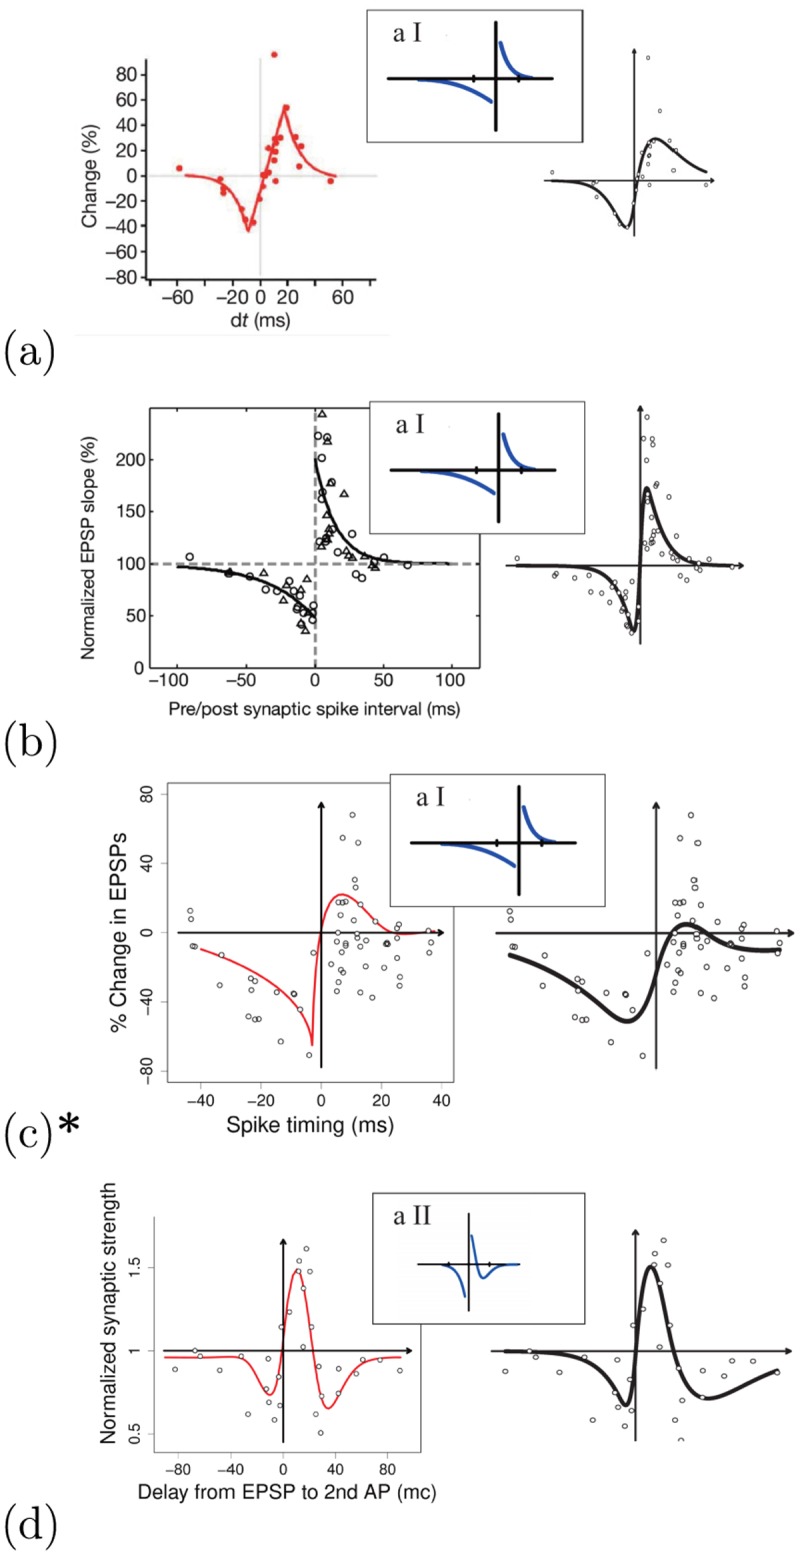
Fig 10. Different STDP data sets, representative of typical STDP learning kernels, fitted with the G-DHL rule.

Each group of graphs refers to one STDP class/subtype and shows: (1) left graph: data and fitting curve from the original article (in ‘a’ and ‘b’: reprinted with permission from respectively [71] and [72]; in ‘c’ and ‘d’: reproduced from data and graphs published in respectively [73] and [74]); (2) right graph: data and fitting curve obtained with the G-DHL regression; (3) top-central graph: learning curve suggested in [18] to capture the STDP kernel (reprinted with permission). When available, the G-DHL regression was based on the original data (graphs with a star: *), otherwise it used the data extrapolated from the published graphs: (a) data extrapolated from [71]; (b) data extrapolated from [72]; (c) original data from [73]; (d) data extrapolated from [74]. Section 3 in S1 Supporting Information presents more detailed data on the regressions as in Fig 8.
