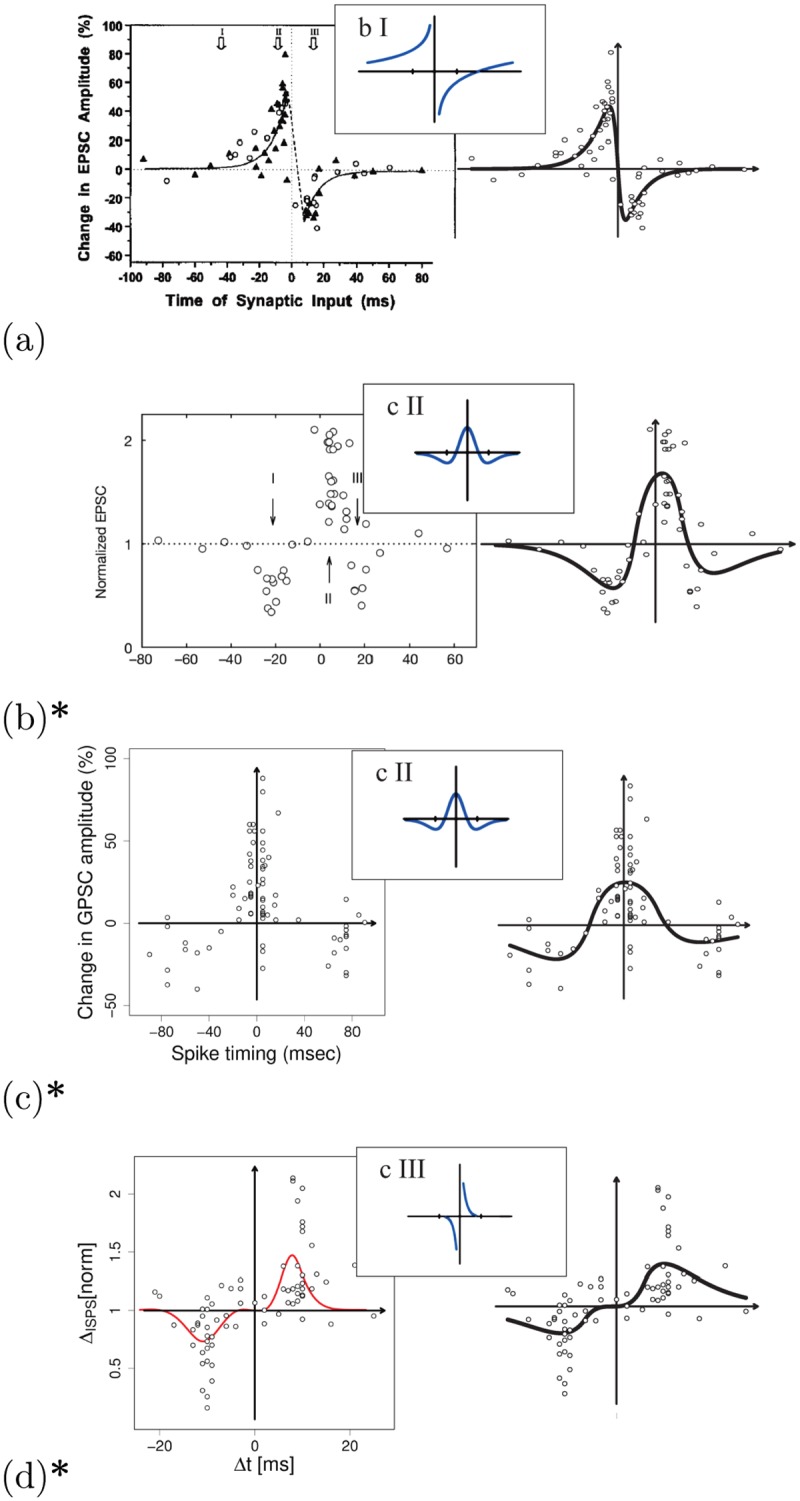
Fig 11. Other STDP data sets and classes/types fitted with G-DHL.

Graphs plotted as in Fig 10 (graphs on the left in ‘a’ and ‘b’: reprinted with permission from respectively [76] and [77]; graphs on the left in ‘c’ and ‘d’: reproduced from data and graphs from respectively [78] and [79]). Right graphs: (a) data extrapolated from [76]; (b) original data from [77]; (c) original data from [78]; (d) original data from [79]. Section 3 in S1 Supporting Information presents more detailed data on the regressions as in Fig 8.
