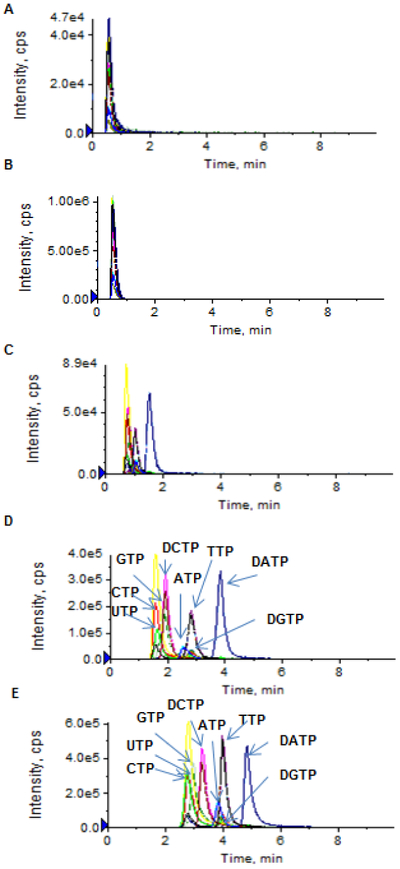
Figure 3.

(A – D) Extracted ion chromatograms of a standard mixture of dATP, dCTP, dGTP, dTTP, ATP, CTP, GTP, and UTP (1 μM in aqueous solution), using the TEA-HFIP ion-paring mobile phase with TEA at 8.6 mM and HFIP at different concentrations: 5 mM (A), 20 mM (B), 50 mM (C), and 100 mM (D). (E) Extracted ion chromatograms of dATP, dCTP, dGTP, dTTP, ATP, CTP, GTP, and UTP (at 1 μM in aqueous solution), using a mobile phase containing HFIP only (100 mM, adjusted pH to 8.3 by NH4OH). Chromatographic separation was achieved on an Atlantis T3 (2.1× 100 mm, 3 μm) column, under a gradient mobile phase consisting of mobile phase A (TEA + HFIP or HFIP only) and mobile phase B (10% acetonitrile in mobile phase A), with gradient B% (min) as 0 (0) → 10 (6.0) → 0 (6.1) → 0 (10) at a flow rate of 0.5 mL/min.
